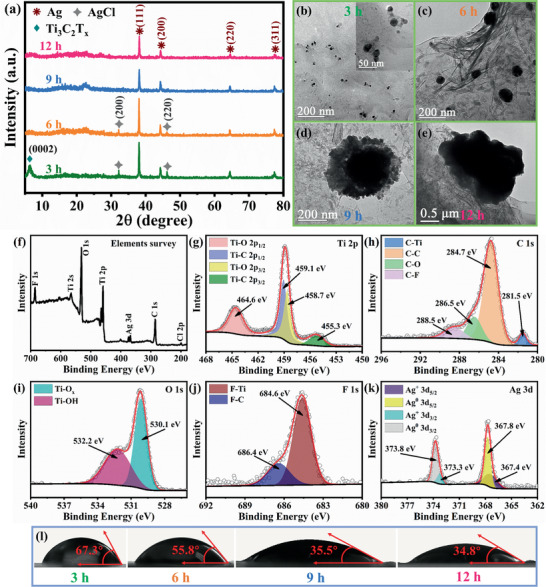
Figure 2.

a) X‐ray diffraction patterns of Ti3C2T x /Ag prepared with different reaction times and b–e) Transmission electron micrographs of Ti3C2T x /Ag with reaction times of 3, 6, 9, and 12 h. X‐ray photoelectron emission spectra of Ti3C2T x /Ag‐3: f) survey spectrum, g) Ti 2p, h) C 1s, i) O 1s, j) F 1s, and k) Ag 3d. l) Optical micrographs of the water contact angles on the surface of Ti3C2T x /Ag corresponding to reaction times of 3, 6, 9, and 12 h.
