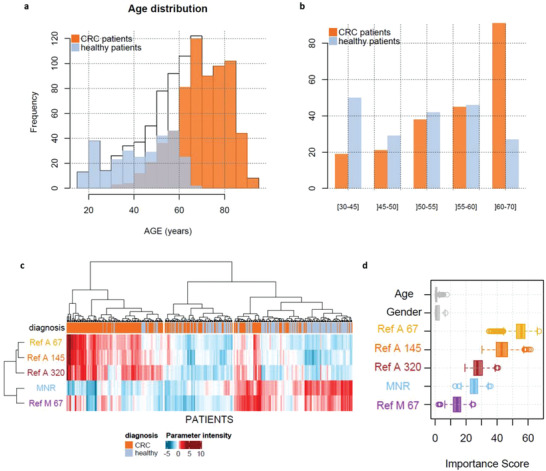
Figure 2.

Representation of patients used for bootstrapping and age correction. a) Age distribution among all patients (white) and the two sub‐populations: patients with colorectal cancer (orange) and healthy patients (blue). b) Categories based on patients’ age, in order to select one patient with colorectal cancer with one healthy patient. c) Ascending hierarchical clustering, performed on all patients used for resampling and all parameters available. d) Boxplot of each parameter importance score obtained after 500 recursive partitioning regression trees and resampling.
