
Figure 3.
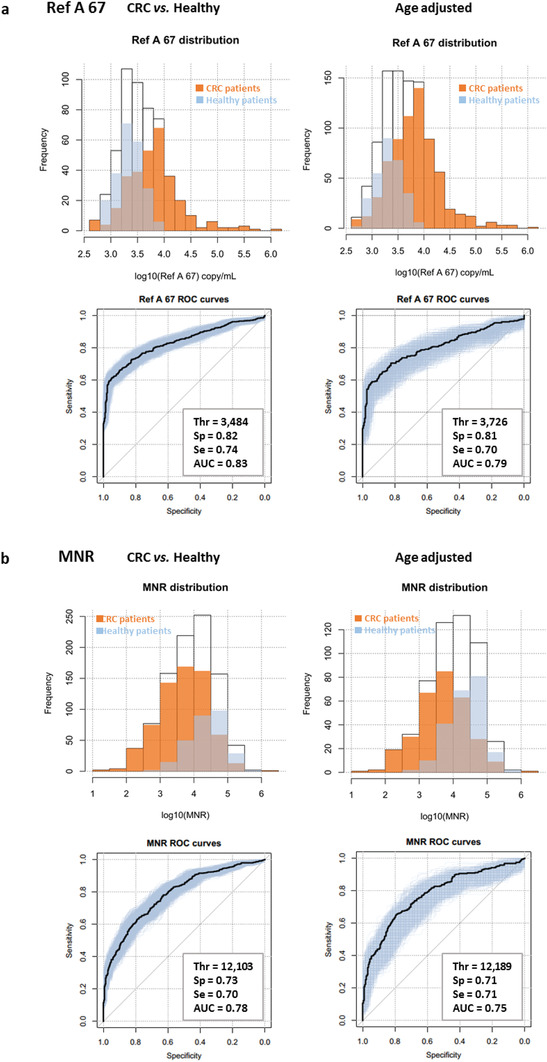
Distribution and ROC curves of a) the Ref A 67 (copy nb mL−1) and b) MNR parameters among all patients (white), CRC patients (orange), and healthy individuals (blue), before and after age adjustment.
Official websites use .gov
A
.gov website belongs to an official
government organization in the United States.
Secure .gov websites use HTTPS
A lock (
) or https:// means you've safely
connected to the .gov website. Share sensitive
information only on official, secure websites.
Distribution and ROC curves of a) the Ref A 67 (copy nb mL−1) and b) MNR parameters among all patients (white), CRC patients (orange), and healthy individuals (blue), before and after age adjustment.