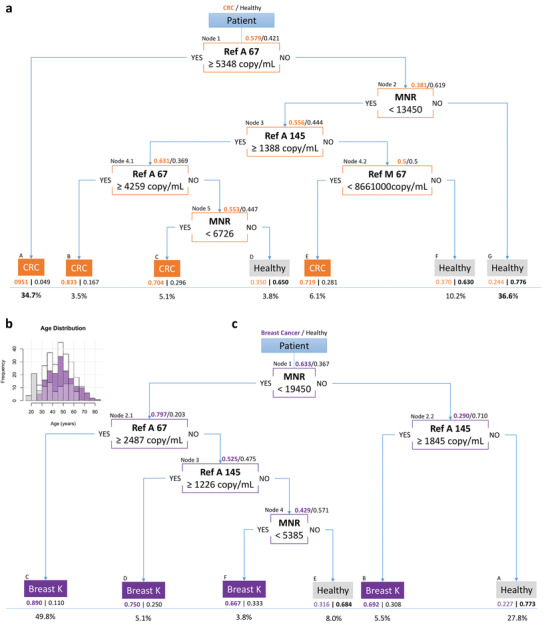
Figure 4.

Global DTs obtained from the colorectal cancer and breast cancer cohorts. a) Global DT obtained from the colorectal cancer cohort by iterating a recursive partitioning regression tree after resampling patients at each step. Proportions of patients with colorectal cancer (orange) and healthy patients (gray) are represented at each node. b) Distribution histogram of the ages of patients (white), in breast cancer patients (purple) and in healthy patients (gray). c) Global DT obtained from the breast cancer cohort by iterating a recursive partitioning regression tree after resampling patients at each step. Proportions of patients with breast cancer (purple) and healthy patients (gray) are represented at each node. Each final leaf in each tree contains the name of the most representative population inside, with their relative proportions. The proportion of patients that ended in each leaf is presented below the corresponding leaf. One node features the parameter of interest, the condition on the parameter (below), and the direction of the answer (YES/NO).
