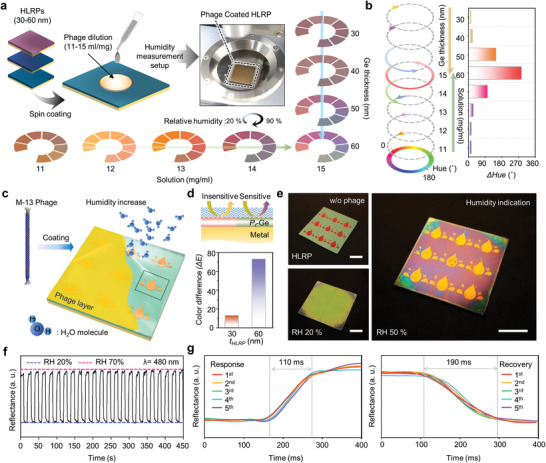
Figure 3.

a) Schematic illustration showing colorimetric sensing optimization process according to phage dilution and absorbing layer (P r‐Ge) thickness with reflectance spectra measurements. b) Degree of hue angle change of various conditions from (a). c) Schematic illustration of colorimetric sensor display with visualization process insensitive/sensitive color difference. d) Regional design of insensitive/sensitive area with different chromatic response (top); color difference (ΔE) of insensitive/sensitive area (bottom). e) Color images of colorimetric sensor display in different states (before/after phage coating, and humidity indicating state, respectively). Scale bar is 1 cm. f) Reproducibility test result and g) response/recovery time measurement result by repeated exposure to RH 20% and 70%.
