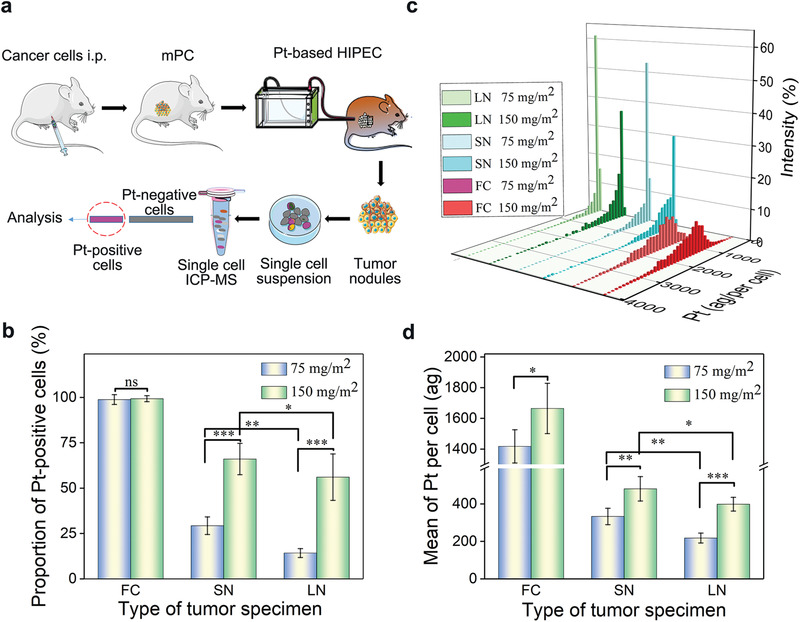
Figure 2.

Quantitative evaluation of drug delivery efficiency of HIPEC at the single cell level. a) Schematic illustration of the experiment to evaluate drug delivery efficiency of HIPEC, i.p.: intraperitoneal injection. b) Proportion of Pt‐uptake cells in free tumor cells and tumor nodules post HIPEC procedure at the indicated conditions. c) Distribution of Pt‐uptake cells based on the level of platinum in free tumor cells and tumor nodules. d) Mean weight of platinum in single cells at the indicated conditions. The data was presented as the mean ± SD from three repeated experiments, One‐way ANOVA was used to determine statistical differences (*p < 0.05, **p < 0.01, ***p < 0.001, ns: not significant). Abbreviation, FC: free tumor cells; SN: small tumor nodules (volume < 10 mm3); LN: large tumor nodules (volume ≥ 10 mm3).
