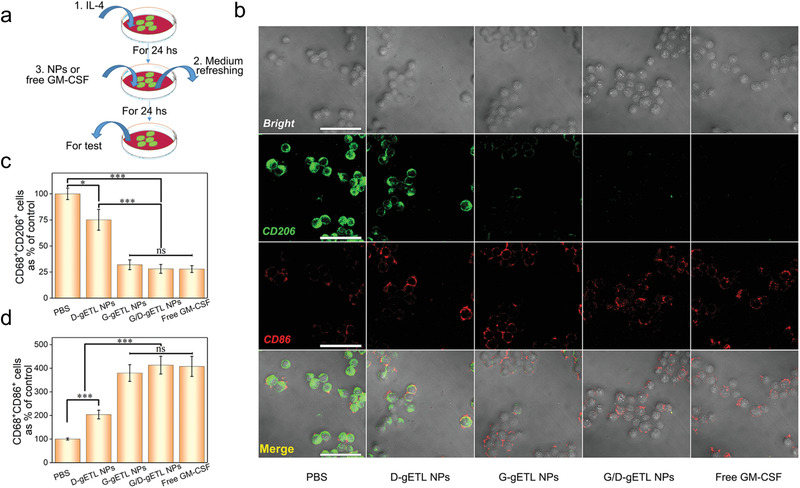
Figure 5.

Characterization of macrophage polarization induced by gETL NPs. a) Schematic illustration of the experiment for characterization of macrophages repolarization. RAW264.7 macrophages were stimulated by IL‐4 to induce M2 phenotype, and then treated with fresh medium containing gETL NPs with various cargos or free GM‐CSF. b) Analysis of the expression of CD206 and CD86 by CLSM. Scale bar:100 µm. c) Flow cytometry analysis of the expression of M2 macrophages markers (CD68+ CD206+). d) Flow cytometry analysis of the expression of M1 macrophages markers (CD68+ CD86+). The data was presented as the mean ± SD from three repeated experiments, One‐way ANOVA was used to determine statistical differences. (*p < 0.05, **p < 0.01 ***p < 0.001, ns: not significant). D‐gETL NPs, NPs loaded with DTX; G‐gETL NPs, NPs loaded with GM‐CSF; G/D‐gETL NPs, NPs loaded with DTX and GM‐CSF.
