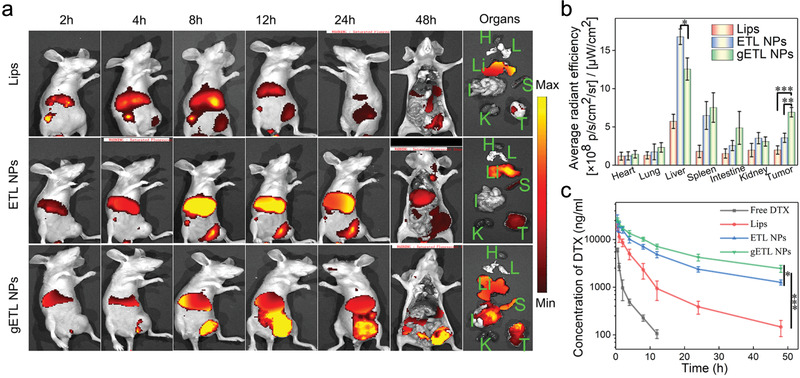
Figure 7.

Biodistribution and pharmacokinetics of NPs in vivo. a) Representative images of the indicated NPs in mice and isolated organs. Tumor‐bearing mice were treated with the tested NPs at a DIR‐equivalent dose of 2.5 mg kg−1 via tail vein. After 48 h, the mice were imaged by IVIS. b) Quantification of the accumulation of NPs in major organs and tumors at 48 h postinjection based on DIR fluorescence (n = 3). c) Quantification of the concentration of DTX in plasma 48 h after intravenous injection of free DTX, DTX‐ liposomes, DTX‐ETL NPs, or DTX‐gETL NPs (at a DTX dose of 5 mg kg−1) into BABL/C mice (n = 3). The data was presented as the mean ± SD from three repeated experiments, One‐way ANOVA was used to determine statistical differences. (*p < 0.05, **p < 0.01, ***p < 0.001). Abbreviation: H, heart; L, lung; Li, liver; S, spleen; I, intestines; K, kidney; T, tumor.
