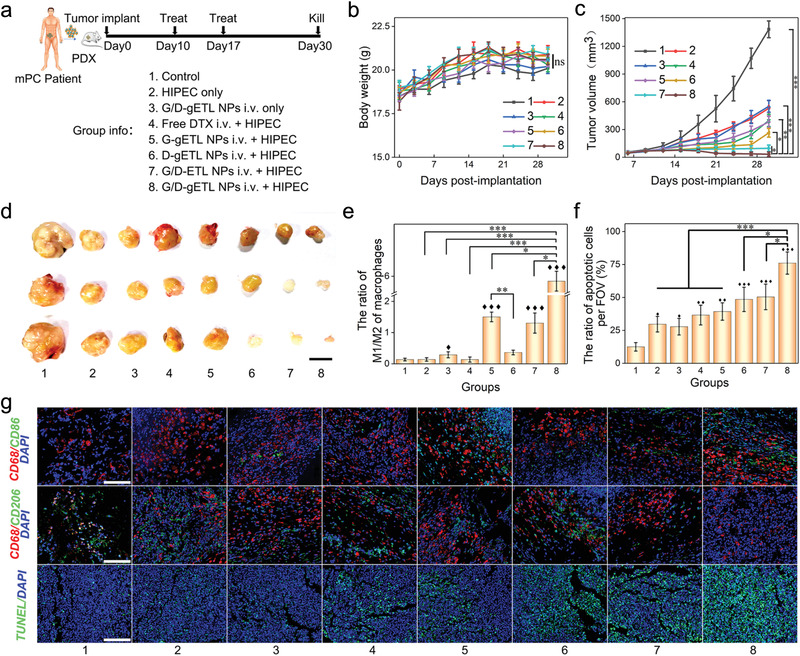
Figure 10.

Characterization of the therapeutic benefits of NPs treatment in patient‐derived mPC tumor xenografts (n = 3). a) Schematic illustration of the experimental design. b) Change of body weight with time. c) Change of body weight with time. d) Outcome of tumor volume at the observing endpoint (day 30), scale bar: 1 cm. e) Quantitative analysis of the ratio of M1 macrophages (CD86+)/M2 macrophages (CD206+) by immunofluorescence staining of tumor sections. f) Quantification of apoptosis of tumor cells detected by TUNEL staining. g) Analysis of tumors by TUNEL staining and immunofluorescence staining of the indicated macrophages markers (CD68+, CD86+, and CD206+) in tumor sections post‐treatments, bar: 100 µm. Mean count (e) or mean apoptotic rate (c) of positive cells from 5 high‐power field per section was used for statistical difference analysis, One‐way ANOVA was used to determine statistical differences; ♦, p < 0.05, ♦♦, p < 0.01, ♦♦♦, p < 0.001, compared with control group; *, p < 0.05; **, p < 0.01, ***, p < 0.001, compared with the indicated groups.
