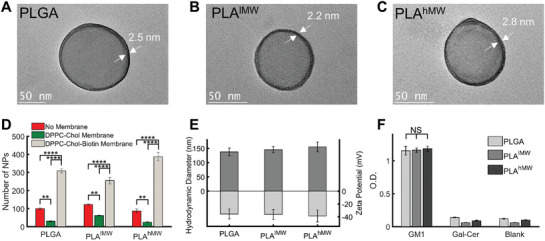
Figure 2.

Characterization of lipid‐wrapped polymer NPs. A–C) High‐resolution TEM images of GM3‐functionalized PLGA, PLAlMW, and PLAhMW NPs. Samples were treated with sodium phosphotungstate (1% w/v in water). White arrows indicate the lipid membrane around the polymer cores. D) Number of NPs bound to a BSA‐Biotin NeutrAvidin treated surface for NPs with and without biotin containing lipids in the membrane as well as for the no membrane controls. For each condition the average number of bound NPs was determined from 5 separate field‐of‐views, error bars represent standard error of the mean (SEM). E) Hydrodynamic diameter and zeta potential of GM3‐presenting PLGA, PLAlMW, and PLAhMW NPs. Error bars represent standard deviation. F) Relative ganglioside (GM1) concentration on the investigated NPs quantified by ELISA performed in triplicates (n = 3). Gal‐Cer‐presenting or blank NPs were included as controls. Error bars represent standard deviation. (Statistical p‐values are determined using one‐way ANOVA followed by a Tukey post‐hoc test, **p ≤ 0.01, ****p ≤ 0.0001, NS, not significant).
