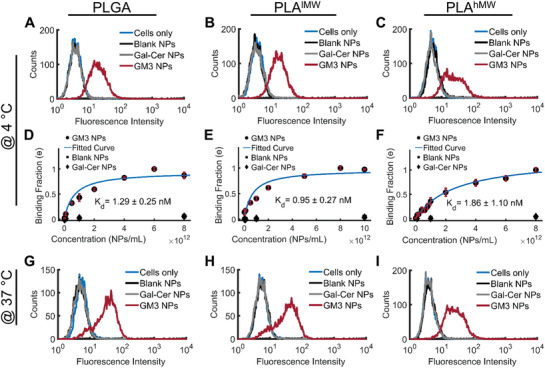
Figure 4.

Specificity of GM3‐CD169 binding of polymer NPs and binding curves obtained with undifferentiated CD169+ THP‐1 cells. A–C) Histograms of fluorescence intensity of NP binding after 60 min incubation at 4 °C. Conditions include GM3‐ or Gal‐Cer‐presenting NPs, or blank NPs with A) PLGA, B) PLAlMW, and C) PLAhMW cores. D,F) Relative binding (normalized geometric‐mean of fluorescence intensity histograms) of CD169+ THP‐1 cells after 60 min incubation at 4 °C. Conditions include GM3‐ or Gal‐Cer‐presenting NPs, or blank NPs with D) PLGA, E) PLAlMW, and F) PLAhMW cores. G–I) Histograms of fluorescence intensity of NP binding after 10 min incubation at 37 °C. Conditions include GM3‐ or Gal‐Cer‐presenting NPs, or blank NPs with G) PLGA, H) PLAlMW, and I) PLAhMW cores. All experiments were performed as triplicates and error bars represent SEM.
