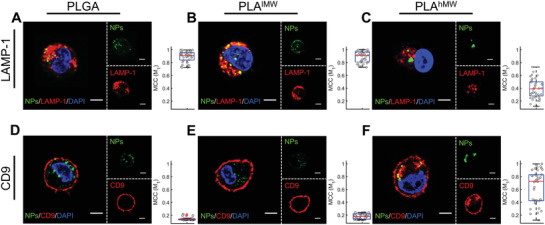
Figure 6.

Mapping the intracellular fate of GM3‐presenting PLGA, PLAlMW, and PLAhMW NPs in CD169‐expressing macrophages after 10 min of incubation with NPs and subsequent chase of 16 h and staining for LAMP‐1 and CD9. A–C) Confocal sections of macrophages stained for LAMP‐1. LAMP‐1 was fluorescently labeled as lysosome marker. D–F) Confocal sections of macrophages NPs with immunolabeled CD9. CD9 was fluorescently labeled as VCC marker. M1 values represent Manders’ Colocalization Coefficients for the overlap of NP signal with the marker of interest. The M1 values of 40 randomly selected cells are included as the box plots. Scale bar = 5 µm.
