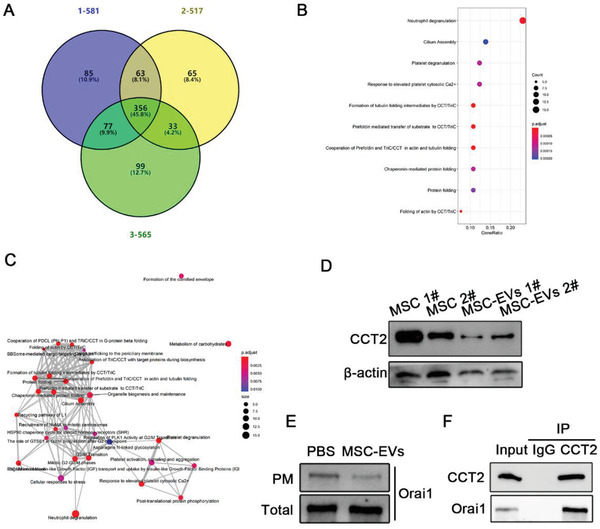
Figure 5.

Proteins are identified from UC‐MSC‐EVs. A) A Venn diagram shows a total of proteins from UC‐MSC‐EVs were identified in three independent samples using LC‐MS/MS analysis. B) Dot plot for the analysis of enriched biological pathways. Y axis, the enriched biological reaction pathways; X axis, GeneRatio. Dot sizes indicate the numbers of proteins found in each enriched pathway. Dot colors indicate the adjusted p‐value. C) A network plot for the interaction of enriched biological pathways. Dot sizes indicate the numbers of proteins found in each enriched pathway. Dot colors indicate the adjusted p‐value. D) To ascertain the results from the proteomic files, CCT2 expression was evaluated by Western blot analysis. The average intensity of the band in the Western blots was quantified using β‐actin as an internal reference. E) The membranous and total expression Orai1 in the CD4+ T cells were, respectively, detected by Western blotting assay. F) Co‐immunoprecipitation with antibody against CCT2 followed by Western blotting using CCT2 and Orai1 antibodies.
