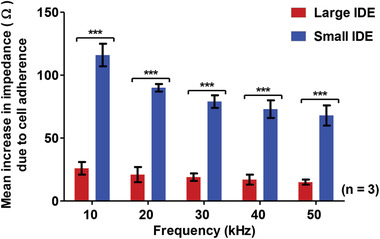
Figure 4.

Mean increases in impedance at different frequencies due to 200 000 MASMCs detected by large IDE and small IDE. Two‐way ANOVA showed that there was a statistically significant (p < 0.001) difference in the mean increase in impedance across all the frequencies (10–50 kHz) n = 3.
