Figure 7.

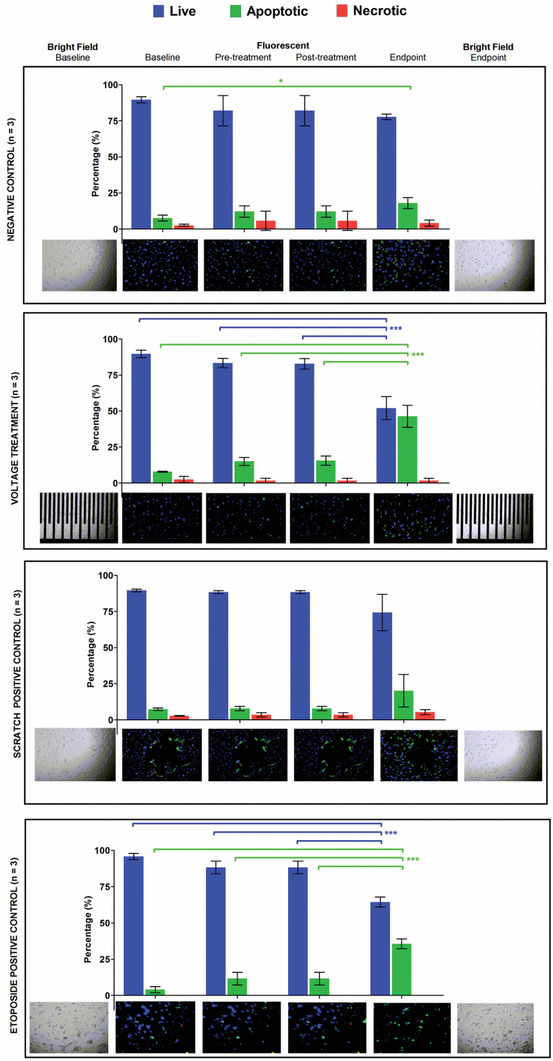
Mean percentages of live, apoptotic, and necrotic cells at the different time points for the negative control without voltage, treatment with voltage, positive control with scratch and positive control with 50 × 10−6 m etoposide.

Mean percentages of live, apoptotic, and necrotic cells at the different time points for the negative control without voltage, treatment with voltage, positive control with scratch and positive control with 50 × 10−6 m etoposide.