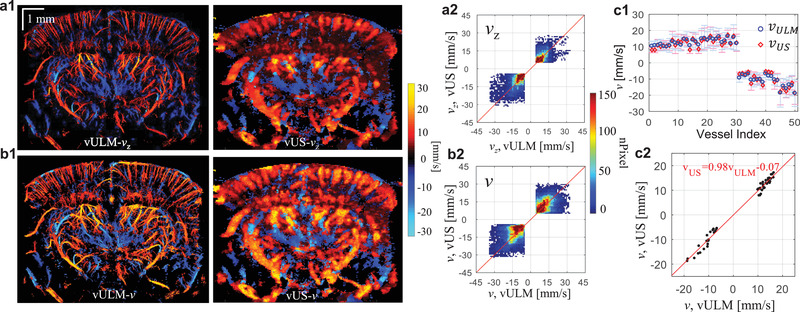
Figure 3.

a,b) In vivo validation between vULM and vUS of axial velocity (a) and total velocity (b). (a2) and (b2) are pixel‐to‐pixel weighted scatter plot of common pixels of vULM and vUS with value |v| > 3 mm s−1. c1) Mean velocity and standard deviation measured with vULM (blue) and vUS (red) of 50 vessels marked in Figure S4a (Supporting Information). c2) Cross correlation of the mean total velocity of the 50 vessels between vULM and vUS (r = 0.984, p < 0.001).
