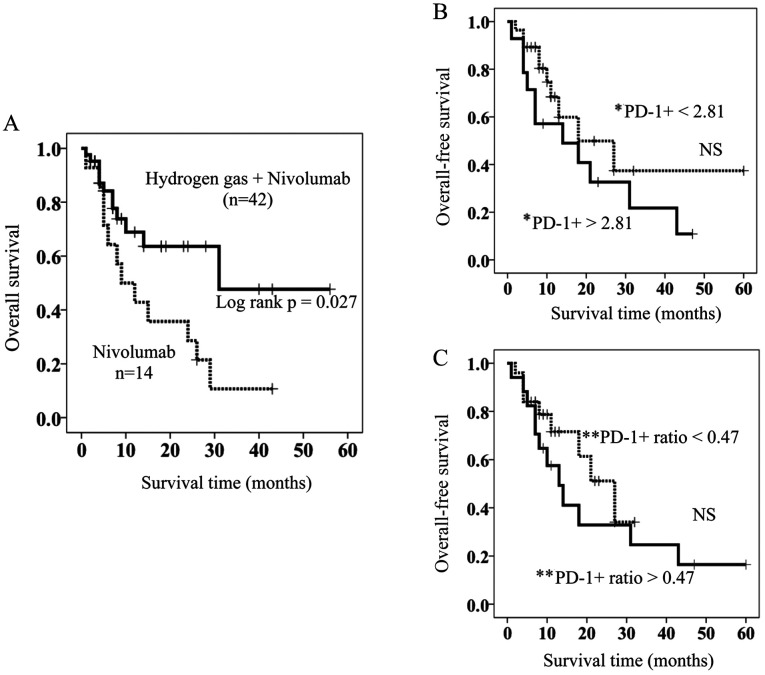
Figure 1.
(A) OS in patients treated with hydrogen gas and nivolumab (solid line) and those treated with nivolumab only (dotted line). (B and C) Comparison of OS in HGN-treated patients with high (solid line) and low (dotted line) of (B) PD-1+ and (C) PD-1+ ratio. *PD-1+ =PD-1+terminal CD8+ T cells, **PD-1+ ratio =PD-1+terminal CD8+ T cells after treatment / PD-1+terminal CD8+ T cells before treatment. OS, overall survival; HGN, Hydrogen gas and Nivolumab; PD-1+, PD-1+terminal CD8+ T cells; PD-1+ ratio; PD-1+terminal CD8+ T cells after HGN treatment / PD-1+terminal CD8+ T cells before HGN treatment.

