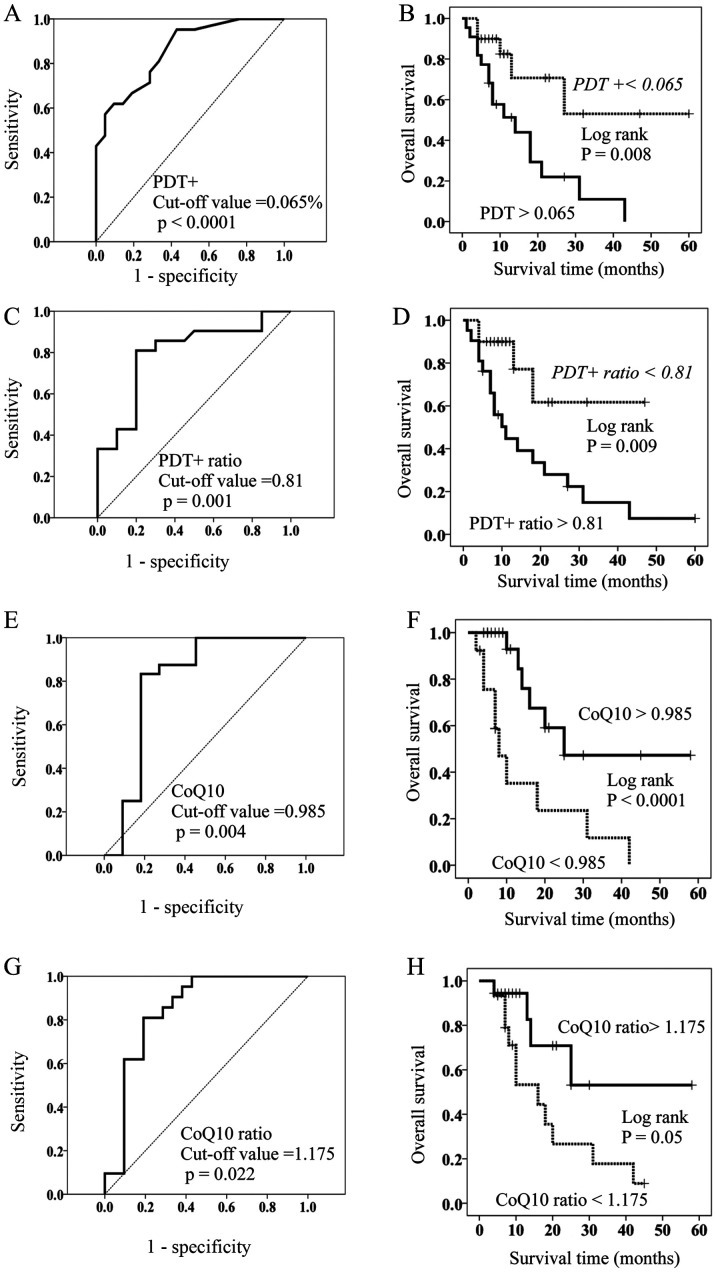
Figure 2.
(A) ROC of OS based on terminal PDT+. The cutoff value was 0.065%. (B) OS in patients with a high- (solid line) and low- (dotted line) proportion of PDT+. (C) ROC curves of OS based on the PDT+ ratio. The cutoff value was 0.81. (D) OS in patients with a high- (solid line) and low- (dotted line) PDT ratio. (E) ROC curves of OS based on the concentration of coenzyme Q10 (CoQ10). The cutoff value was 0.985 µg/ml. (F) OS in patients with a high- (solid line) and low- (dotted line) concentration of CoQ10. (G) ROC curves of OS based on the CQ10 ratio. The cutoff value was 1.175. (H) OS in patients with a high- (solid line) and low- (dotted line) CoQ10 ratio. OS, overall survival; PDT+, PD-1+Tim-3+ terminal CD8+ T cells; PDT+ ratio, PD-1+Tim-3+terminal CD8+ T cells after HGN treatment /PD-1+Tim-3+terminal CD8+ T cells before HGN treatment; CoQ10 ratio, CoQ10 after HGN treatment/CoQ10 before HGN treatment; ROC, Receiver operating characteristic curves.

