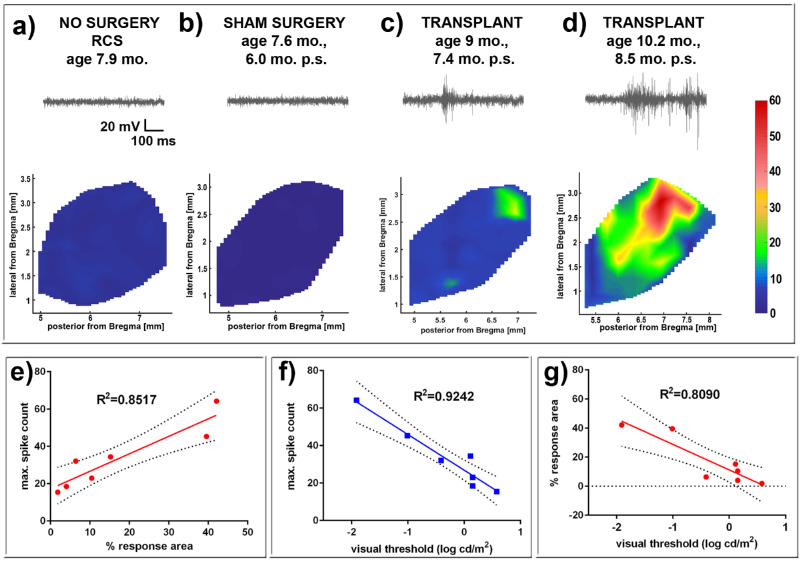
Figure 12.
SC recording (see also Supplementary Fig. S5). Representative spike count heatmaps and sample traces of SC recorded visually evoked responses of (a) nonsurgery age matched control, (b) sham surgery, and two transplanted rats with responses (c, d; transplant #2 and #5). The sample traces start about 100 ms before the 20 msec light stimulus. No response was found in the entire SC area of nonsurgery age-matched control and sham rats. Strong responses were found in some areas of the SC in 7 of 14 recorded transplant rats (see Tables 2 and 3). (e) Maximum spike count versus percent response area (R2 = 0.8517). (f) Maximum spike count versus visual threshold (R2 = 0.9242). (g) Percent response area versus visual threshold (R2 = 0.8090).

