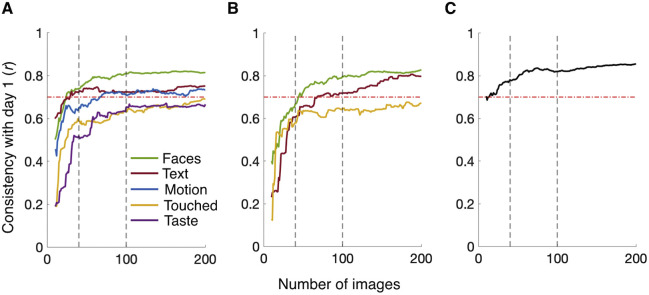
Figure 2.
Consistency of fixation ratios based on smaller stimulus sets. Line plots depicting Pearson consistency correlations of individual differences in percent cumulative fixation time (A), percent first fixations (B), and visual exploration (number of distinct objects fixated) (C) between the full image set (day 1) and a given subset (10 to 200 images from day 2; x-axis). Dashed gray lines mark stimulus sets of 40 and 100 images. Dashed red lines indicate the consistency threshold of r = 0.7. Colors in (A) and (B) indicate semantic dimensions as shown in the inset.

