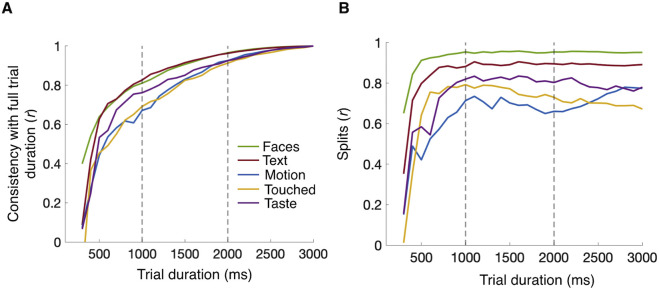
Figure 3.
Consistency of estimates for truncated trial durations. (A) Line plots show the correlation of percent cumulative fixation time observed for the full trial duration with the corresponding values for different steps of truncation (starting from 1000 ms to 3000 ms in steps of 100 ms as shown on the x-axis; all data from day 1). (B) Line plot on the right-hand side presents split-half correlations across odd and even images for different steps of truncation. Dashed gray lines mark free viewing durations of 1000 ms and 2000 ms. Semantic dimensions are indicated by color as shown in the insets.

