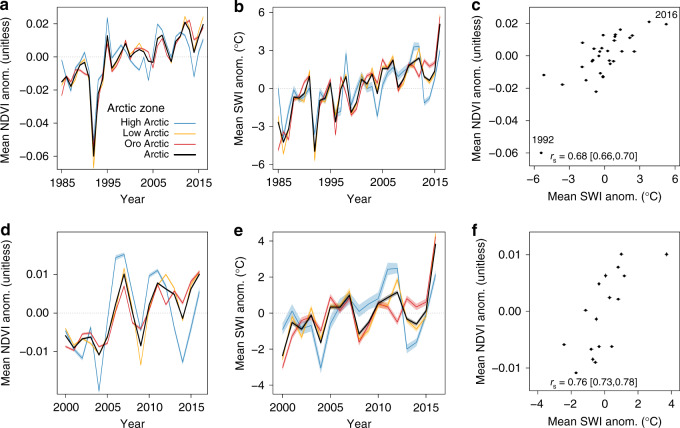
Fig. 2. Tundra greenness and summer air temperature time series and covariation.
Left panels show changes in mean Landsat NDVImax [unitless] anomalies for the Arctic and each zone from 1985 to 2016 (a) and 2000 to 2016 (d). Middle panels show changes in mean summer warmth index [SWI; °C] anomalies from 1985 to 2016 (b) and 2000 to 2016 (e) derived from five temperature data sets. Right panels show the relationship between mean Arctic NDVImax and SWI anomalies from 1985 to 2016 (c) and 2000 to 2016 (f). Spearman’s correlation coefficients (rs) relating NDVImax and SWI are provided for each period. Narrow error bands and whiskers depict 95% confidence intervals derived from Monte Carlo simulations (n = 103). Note that while mean SWI time series are based on pan-Arctic data, the NDVImax time series, and NDVImax–SWI relationships are based on sites where Landsat data were available from 1985 to 2016 (a, c) and 2000 to 2016 (d, f), as shown in Fig. 1.

