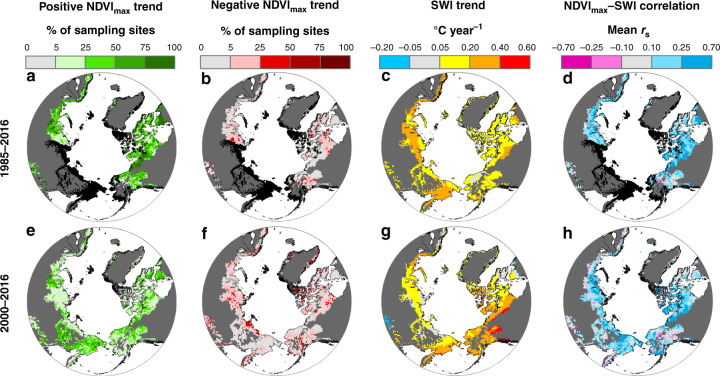
Fig. 4. Tundra greenness and summer air temperature trends and correlations across the Arctic.
Top panels (a–d) depict Landsat NDVImax trends, summer warmth index (SWI) trends, and NDVImax–SWI correlations from 1985 to 2016, while bottom panels (e–h) depict trends and correlations from 2000 to 2016. Trends in tundra greenness were inferred at random sampling sites (Fig. 1b, c) using NDVImax time series and Mann–Kendall trend tests. The percent of sites with positive (a, e) and negative (b, f) trends [α = 0.10] was summarized within 50 × 50 km2 grid cells. c, g Changes in annual SWI derived using an ensemble of five temperature data sets. d, h Mean Spearman’s correlation (rs) between annual NDVImax and SWI among sites within each 50 × 50 km2 grid cell. The maps also depict areas in the Arctic that are barren [mean NDVImax < 0.10; dark gray] or lacked adequate Landsat data for trend and correlation assessments [black].

