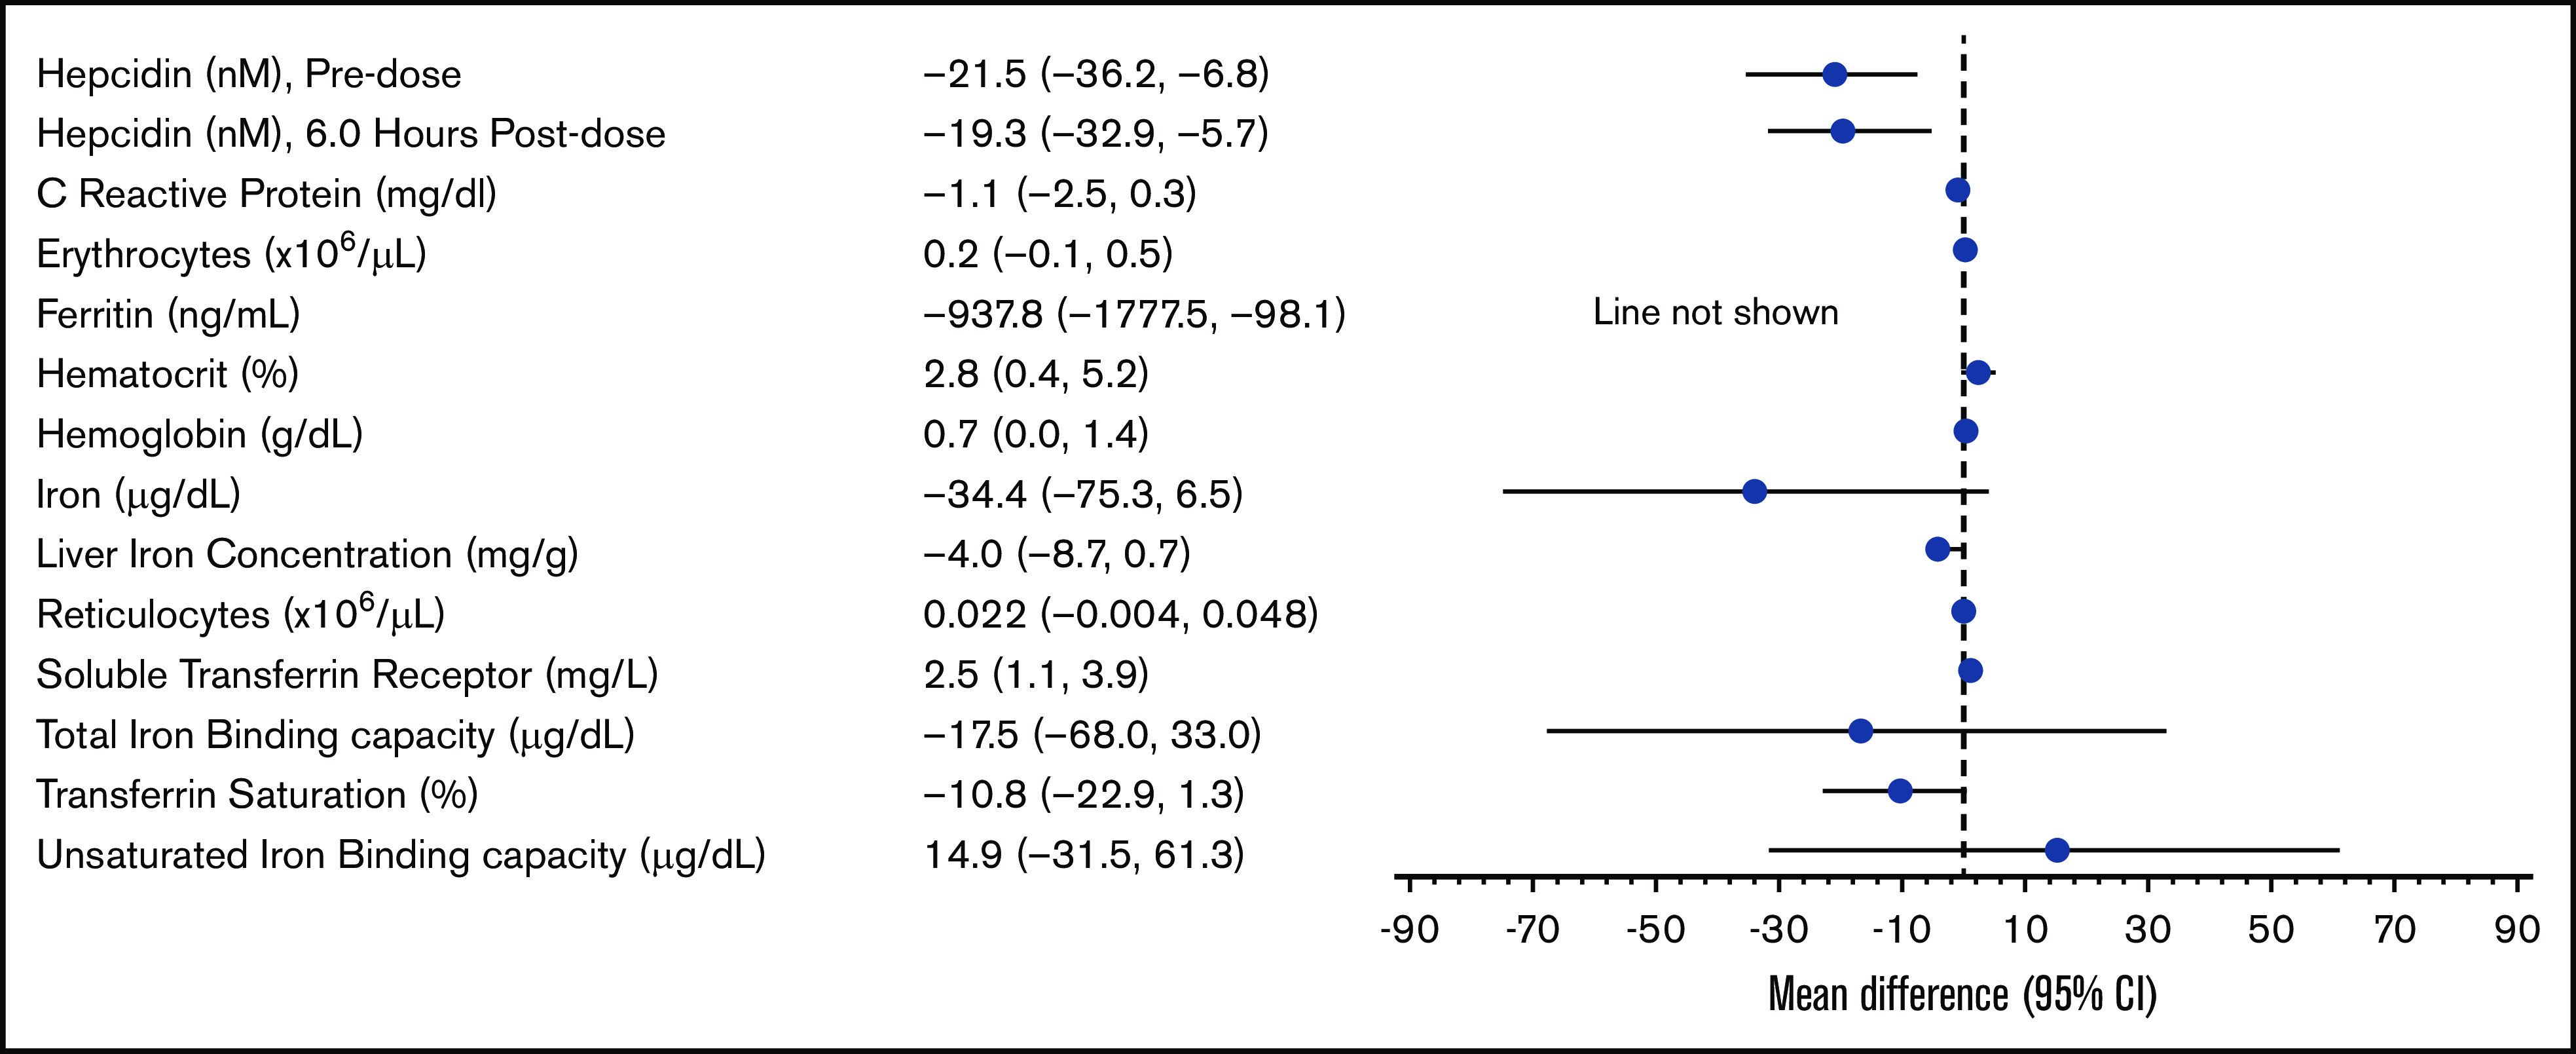
Figure 6.

Baseline biomarkers in TI-R and TI-NR subgroups. Forest plot of baseline differences between subgroups; 95% CI is based on 2-sample Student t test. Positive values represent higher baseline values in the TI-R subgroup than in the TI-NR subgroup, and negative values are lower in the TI-R subgroup than in the TI-NR subgroup.
