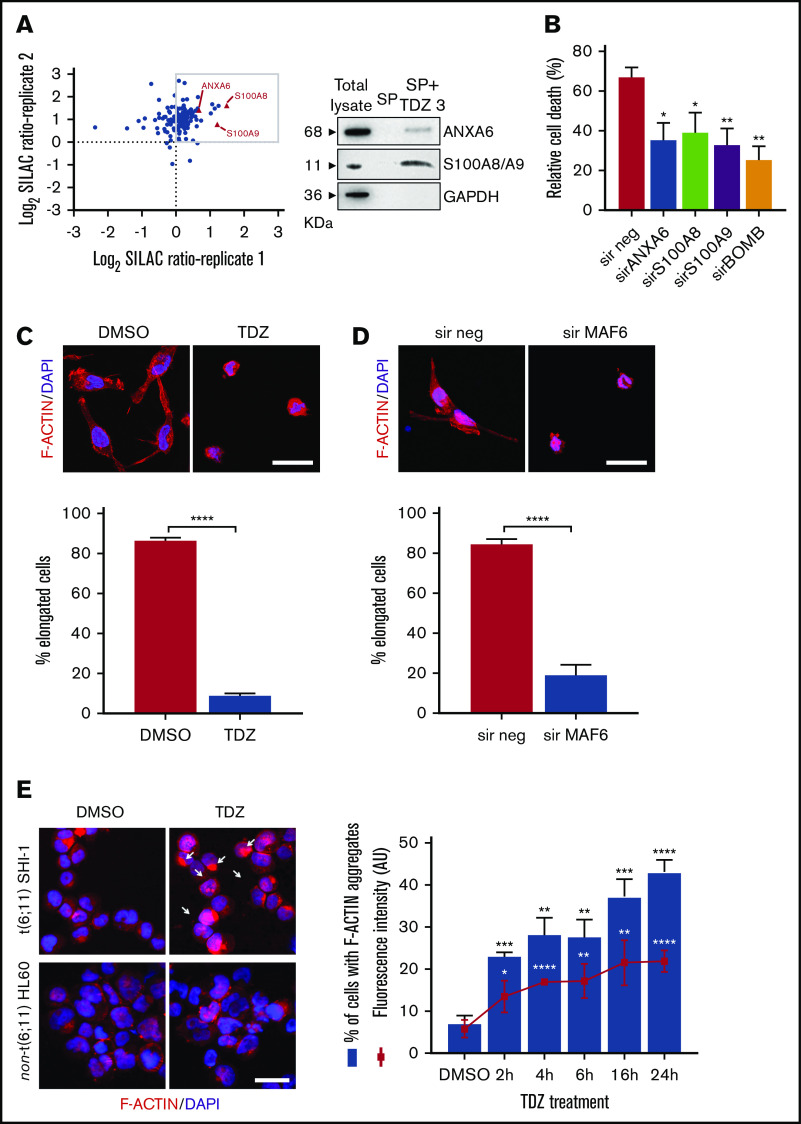
Figure 3.
TDZ induces cytoskeletal rearrangement. (A) Scatterplot of the common SHI-1 proteins identified in 2 independent experiments of quantitative proteomics combined with affinity enrichment. Each data point is a single protein; proteins with log2 SILAC ratio >0 (box) denote the 88 inferred targets identified with buffer 1, whereas the 3 proteins represented by red triangles are those confirmed by buffer 2 (n = 2). Immunoblot analysis for SILAC validation. SHI-1 total proteins. Proteins eluted in the SP without TDZ3 (SP) and with TDZ3 (SP+TDZ3) were analyzed by western blot. (B) Cell death (annexin V+, PI+, and annexin V+/PI+) induced after 24 hours of treatment with TDZ 10 µM treatment in SHI-1 cell lines after ANXA6, S100A8, and S100A9 silencing (sir), used alone or combined (sirBOMB). (C-D) Representative confocal immunofluorescence images of SHI-1 cells seeded onto fibronectin-coated slides 4 hours after TDZ treatment (C), or 60 hours after silencing (sir) of MLL-AF6 fusion gene (D), stained with F-actin antibody (red) and diamidino-2-phenylindole (DAPI; blue) as the nuclear counterstain. Histograms represent the percentage of elongated cells (panel C; n = 46-146 cells and n = 114-225 cells). Original magnification ×63. Bars represent 10 μm. (E) Immunofluorescence of centrifuged SHI-1 and HL60 cells 4 hours after TDZ treatment, stained with F-actin antibody (red) and with DAPI (blue) as the nuclear counterstain. Arrows indicate F-actin aggregates. Histogram represents the percentage of SHI-1 cells containing F-actin aggregates 2, 4, 6, 16, or 24 hours after TDZ treatment (n = 152-333 cells). Original magnification ×63. Bar represents 10 μm. Data are the mean ± SEM. *P < .05; **P < .01; ***P < .001; ****P < .0001. Original magnification ×40. Bar represents 10 μm. AU, arbitrary unit.

