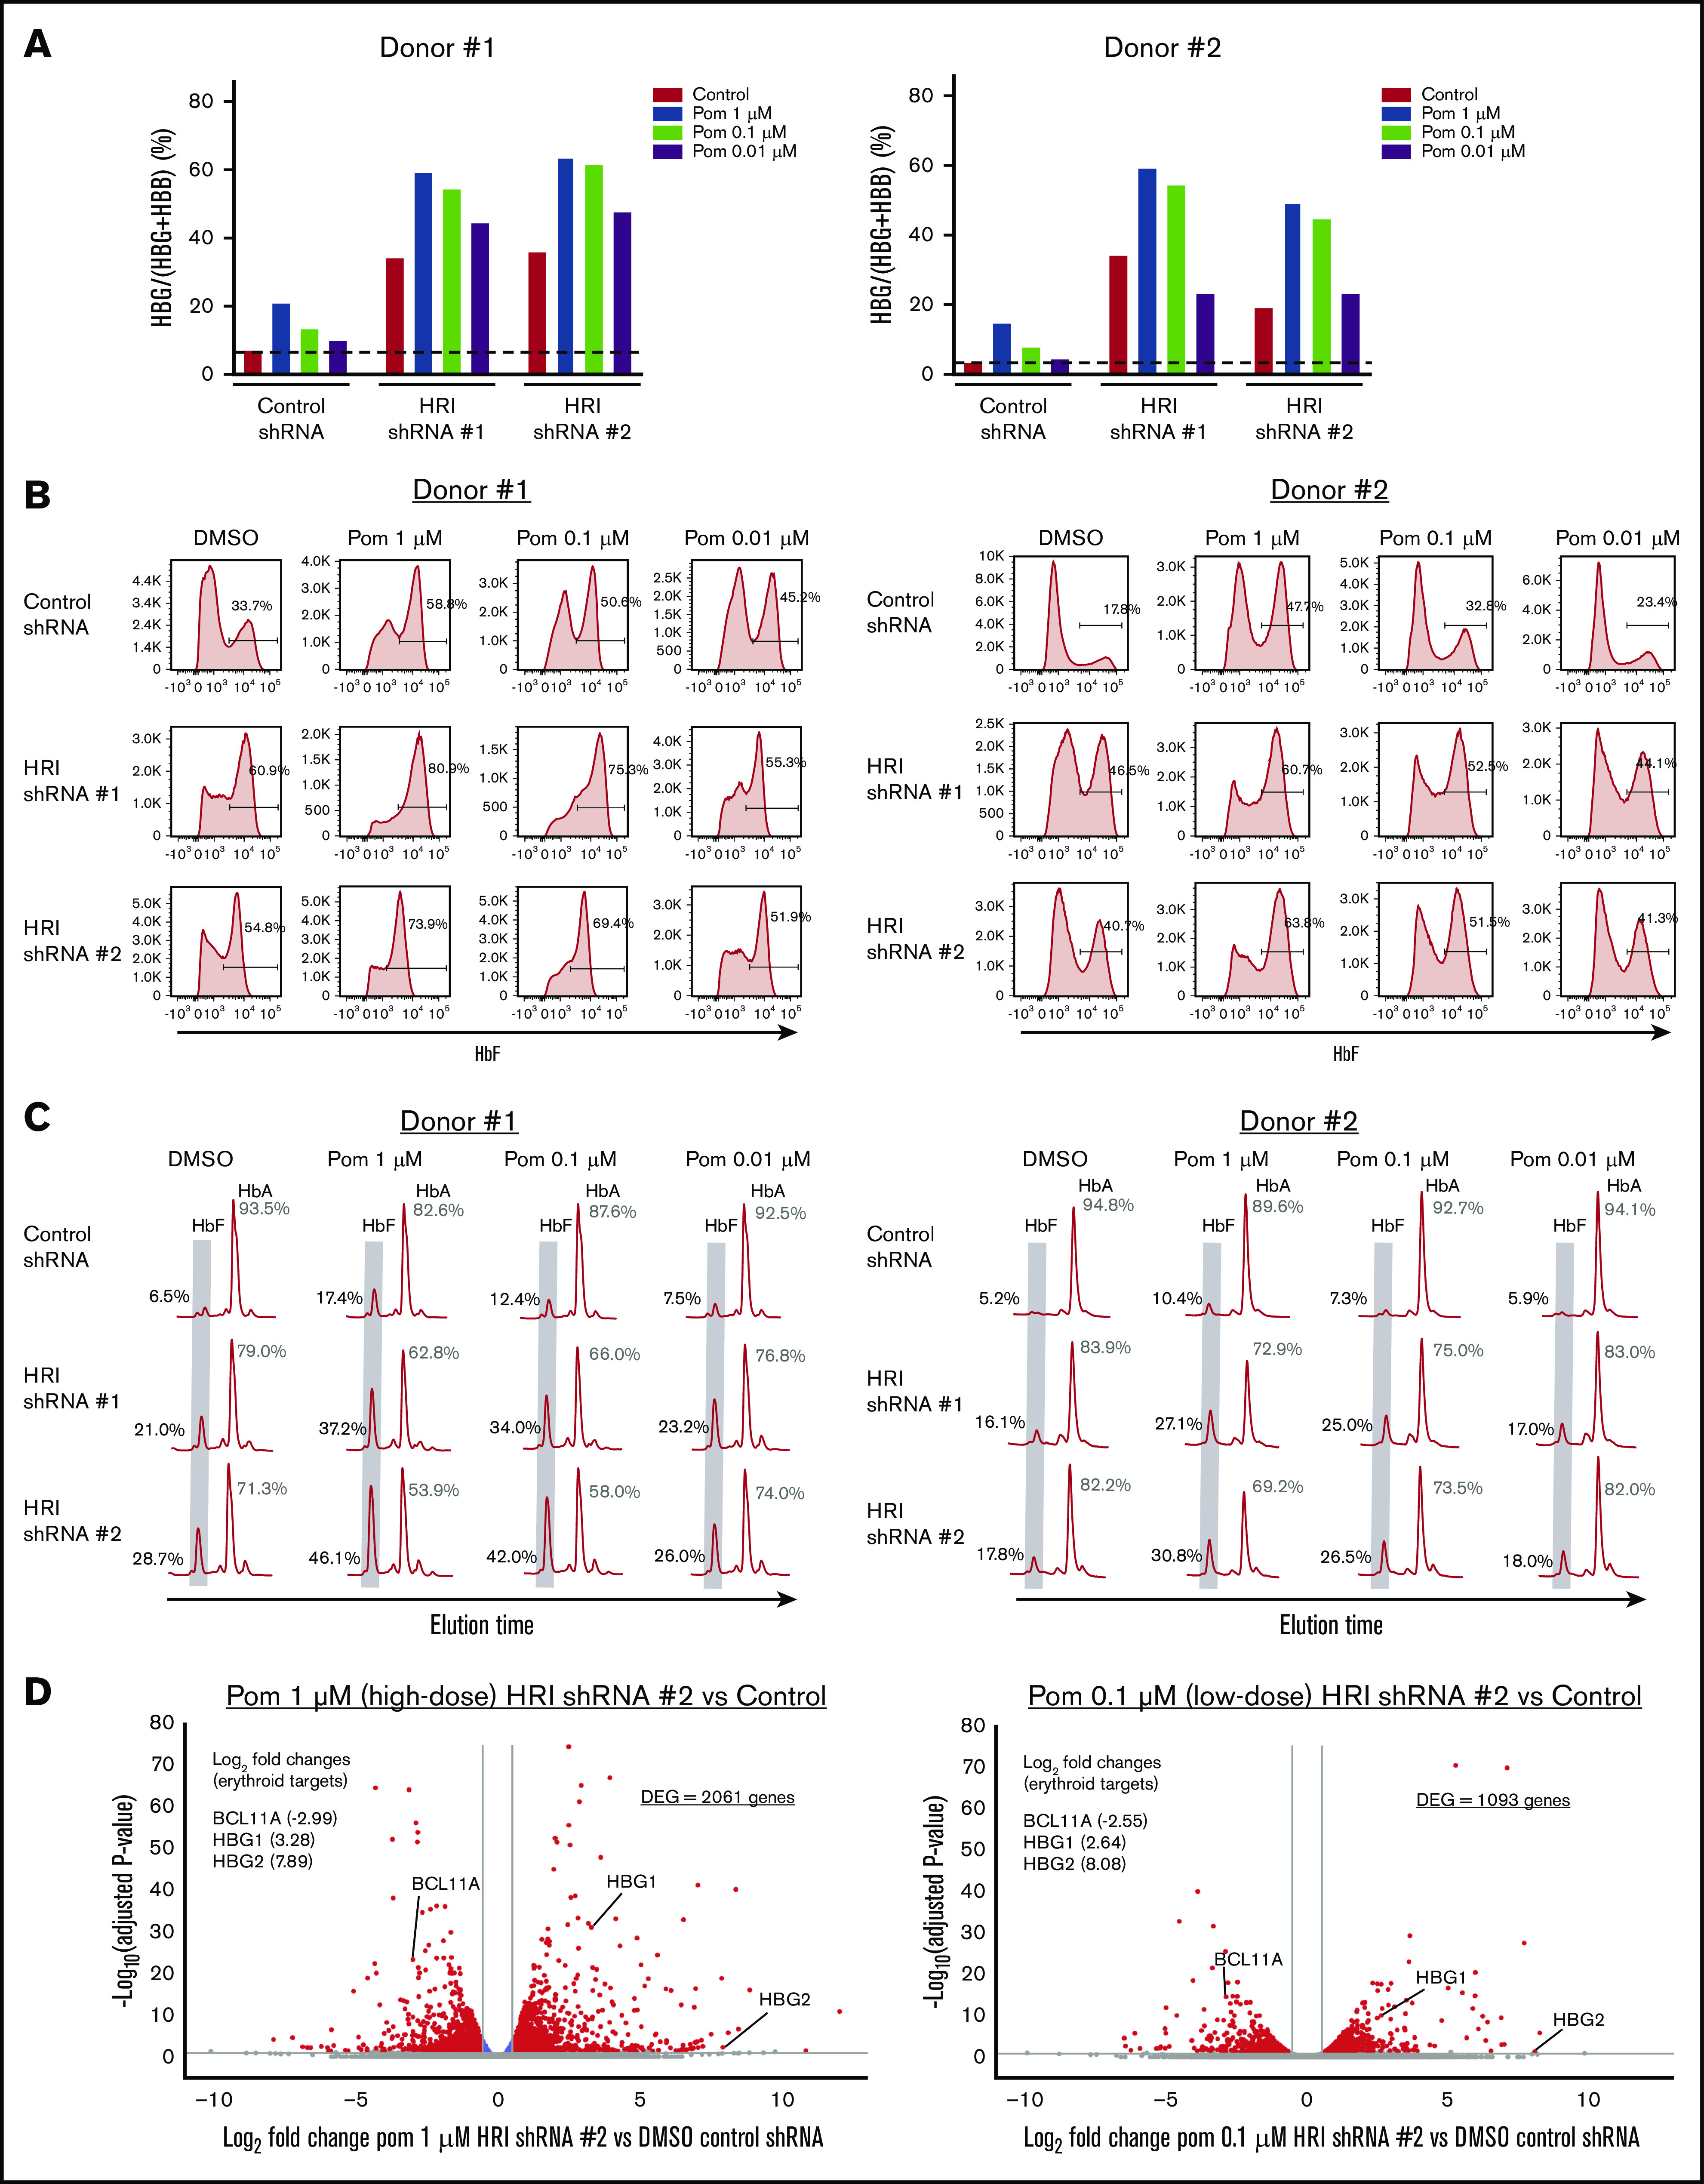
Figure 4.

HRI loss sensitizes cells to low doses of pomalidomide. (A) γ-Globin levels (expressed as γ-globin/γ-globin+β-globin) in healthy CD34+ donors as measured by qRT-PCR after shRNA scrambled control or HRI depletion with 2 independent shRNAs combined with either vehicle control or treatment with 1, 0.1, or 0.01 μM of pomalidomide (Pom). (B) Representative HbF flow cytometric plots. Percentage of F-cells quantified for each sample. (C) Representative HPLC tracings of HbF and HbA (quantified as the percentage of total HbF+HbA peaks). (D) RNA-Seq combinatorial analysis of DMSO-treated control shRNA samples vs pomalidomide-treated HRI shRNA #2 samples at 1 μM (high dose) or 0.1 μM (low-dose) pomalidomide plotted as log2-fold change vs −log10-adjusted P value. Red, absolute fold change >1.5 and adjusted P < .05; blue, absolute fold change ≤1.5 and adjusted P < .05; gray, not significant. Two independent biological replicates for all experiments. DMSO served as the pharmacologic vehicle control. Error bars represent standard deviation. DEG, differentially expressed gene.
