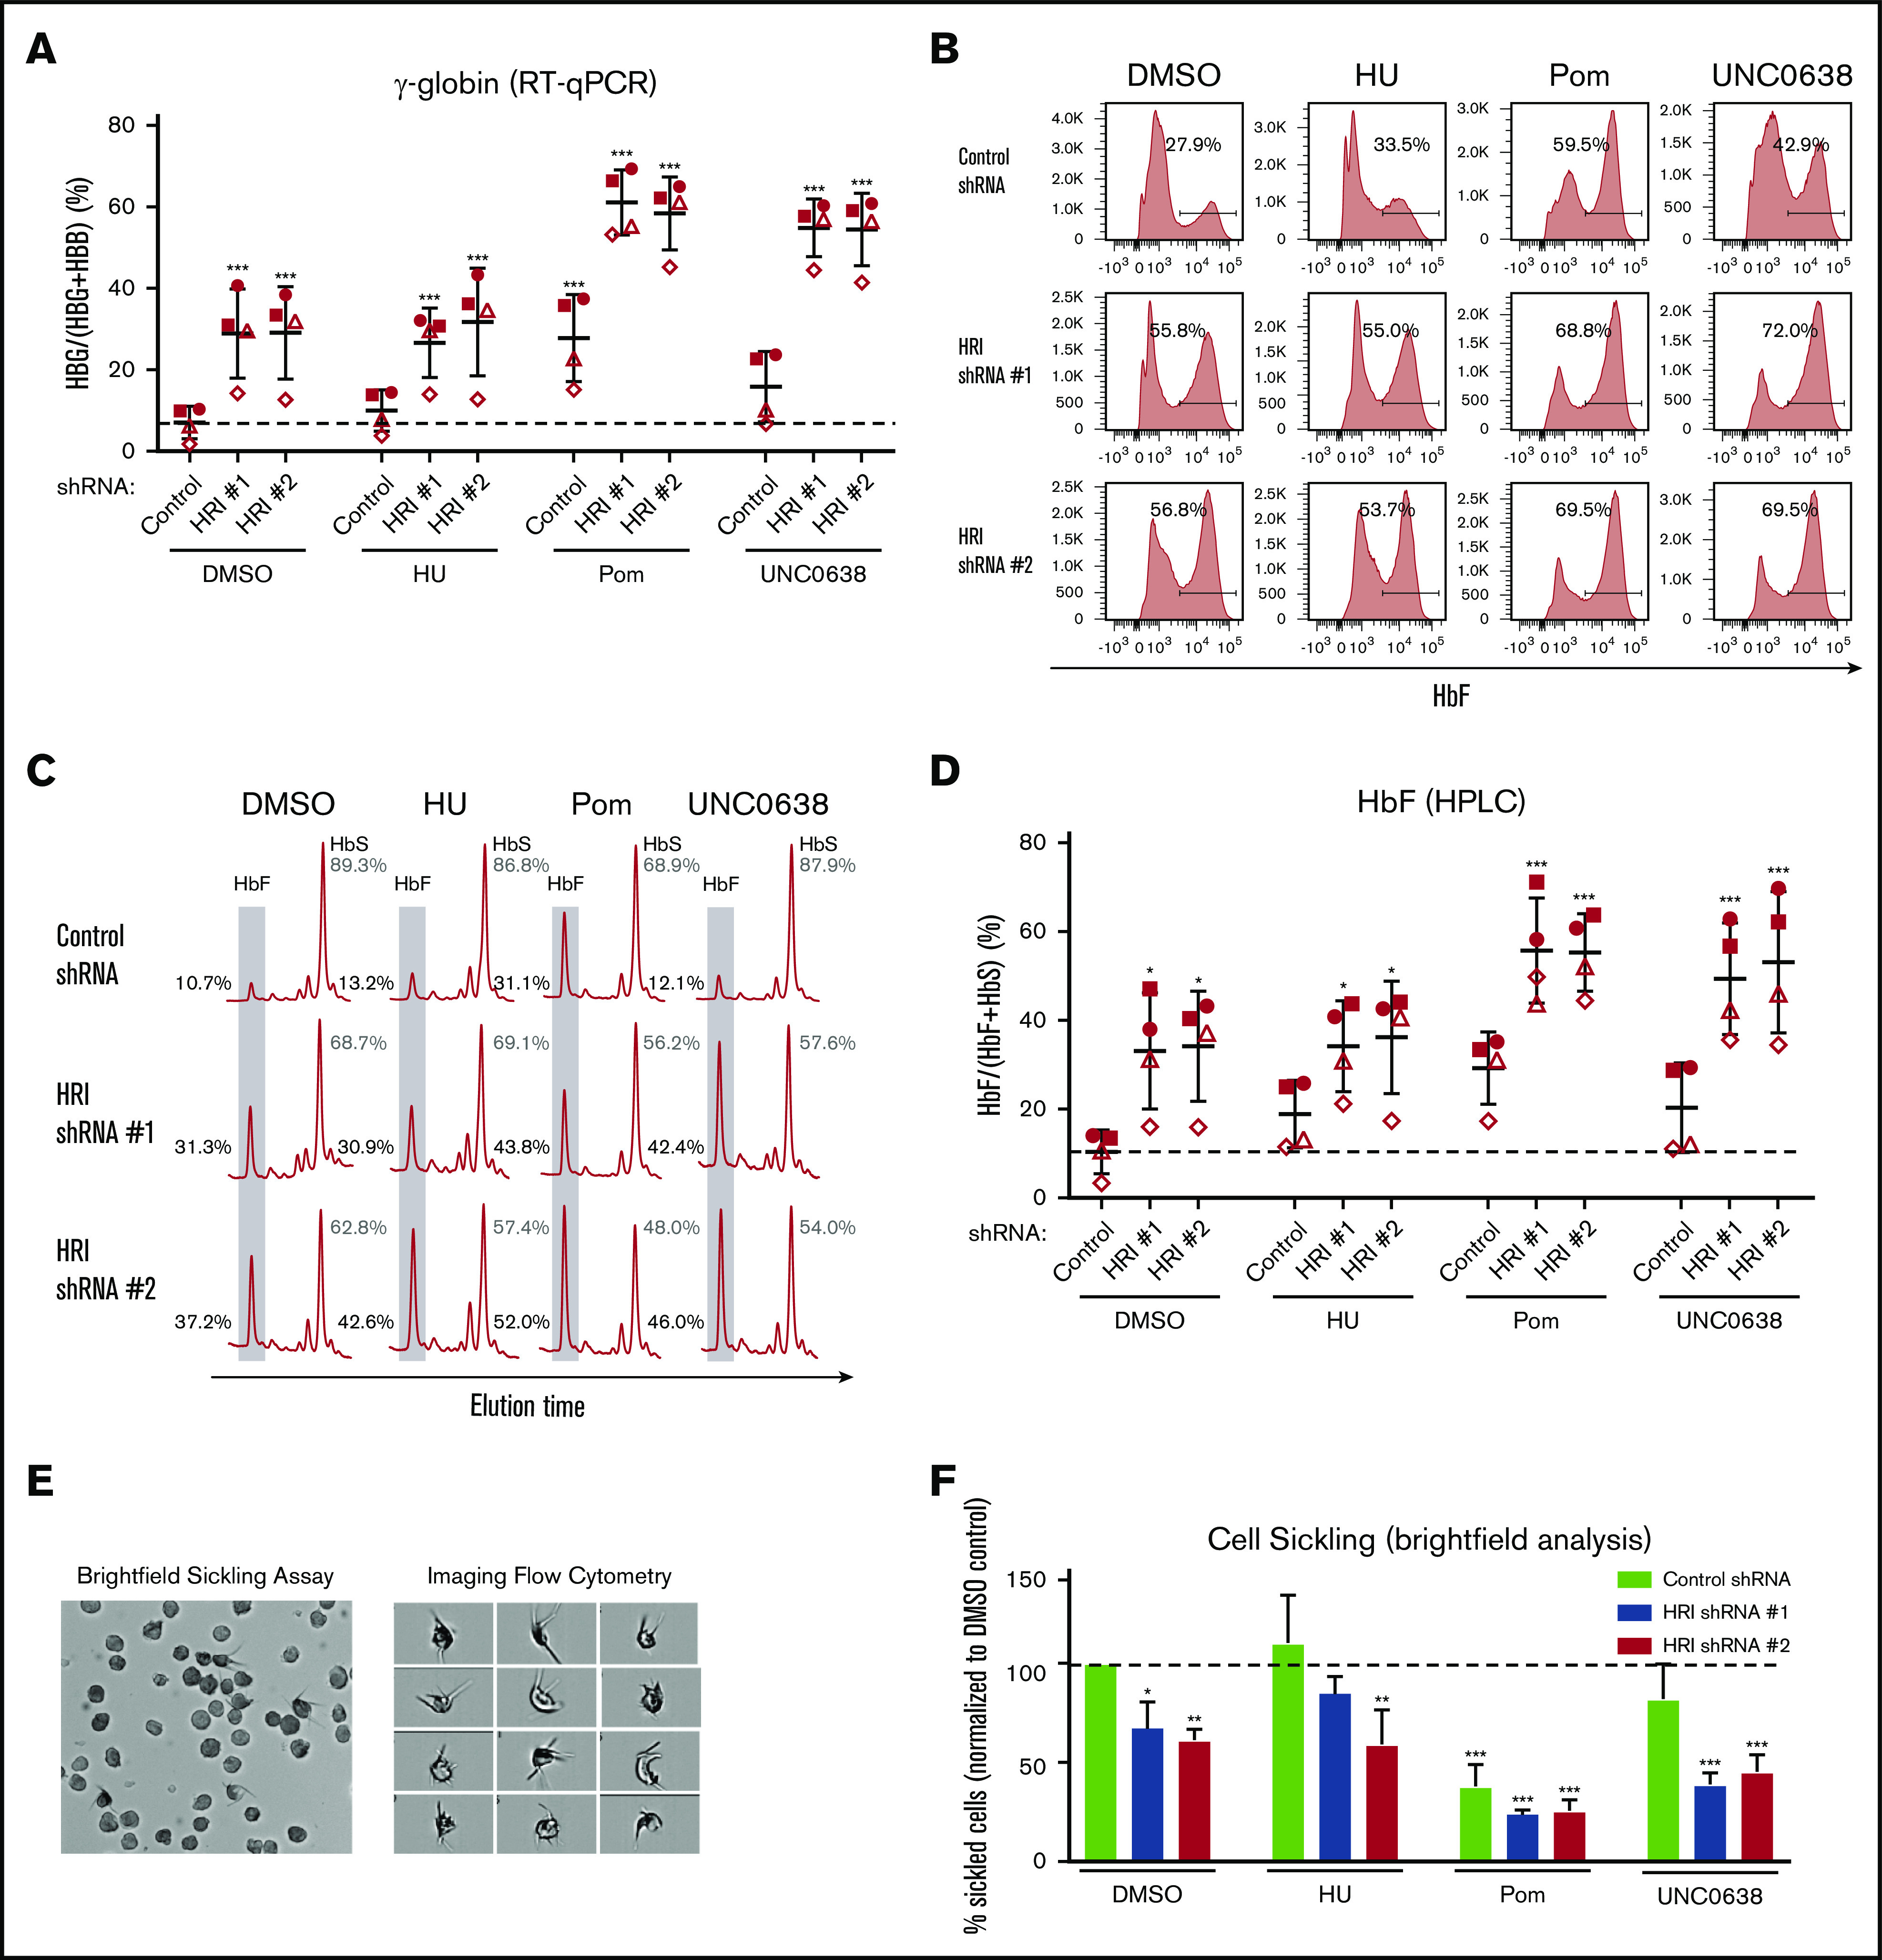
Figure 5.

HRI knockdown induces HbF to high levels in SCD patient-derived cells and cooperates with pomalidomide and UNC0638. (A) γ-Globin levels (expressed as γ-globin/γ-globin+β-globin) in patient-derived SCD samples as measured by qRT-PCR after shRNA scrambled control or HRI depletion with 2 independent shRNAs combined with either vehicle control or HbF pharmacologic induction (50 μM HU, 1 μM pomalidomide [Pom], or 0.125 μM UNC0638). (B) Representative HbF flow cytometric plots. Percentage of F-cells quantified for each sample. (C) Representative HPLC tracings of HbF and HbS. (D) HbF levels (quantified as percent of total HbF+HbS peaks) by HPLC. Each symbol (circle, square, triangle, diamond) represents a biologically independent sample. (E) Representative bright-field images or flow cytometry image capture of SCD-derived cells after 2% O2 exposure (low-O2 sickling assay). Brightfield images were captured at 40× resolution on an Olympus BX60 microscope with Infinity software, while imaging flow cytometry images were captured at 60× resolution on an ImagestreamX imaging flow cytometer. (F) Quantitation by bright-field microscopy of percentage of sickled cells (normalized to DMSO control) after a low-O2 sickling assay. DMSO serves as pharmacologic vehicle control. Three independent biological replicates for all experiments. Statistical analyses by 2-way analysis of variance. Error bars represent standard deviation. *P < .05; **P < .01; ***P < .001, vs DMSO control.
