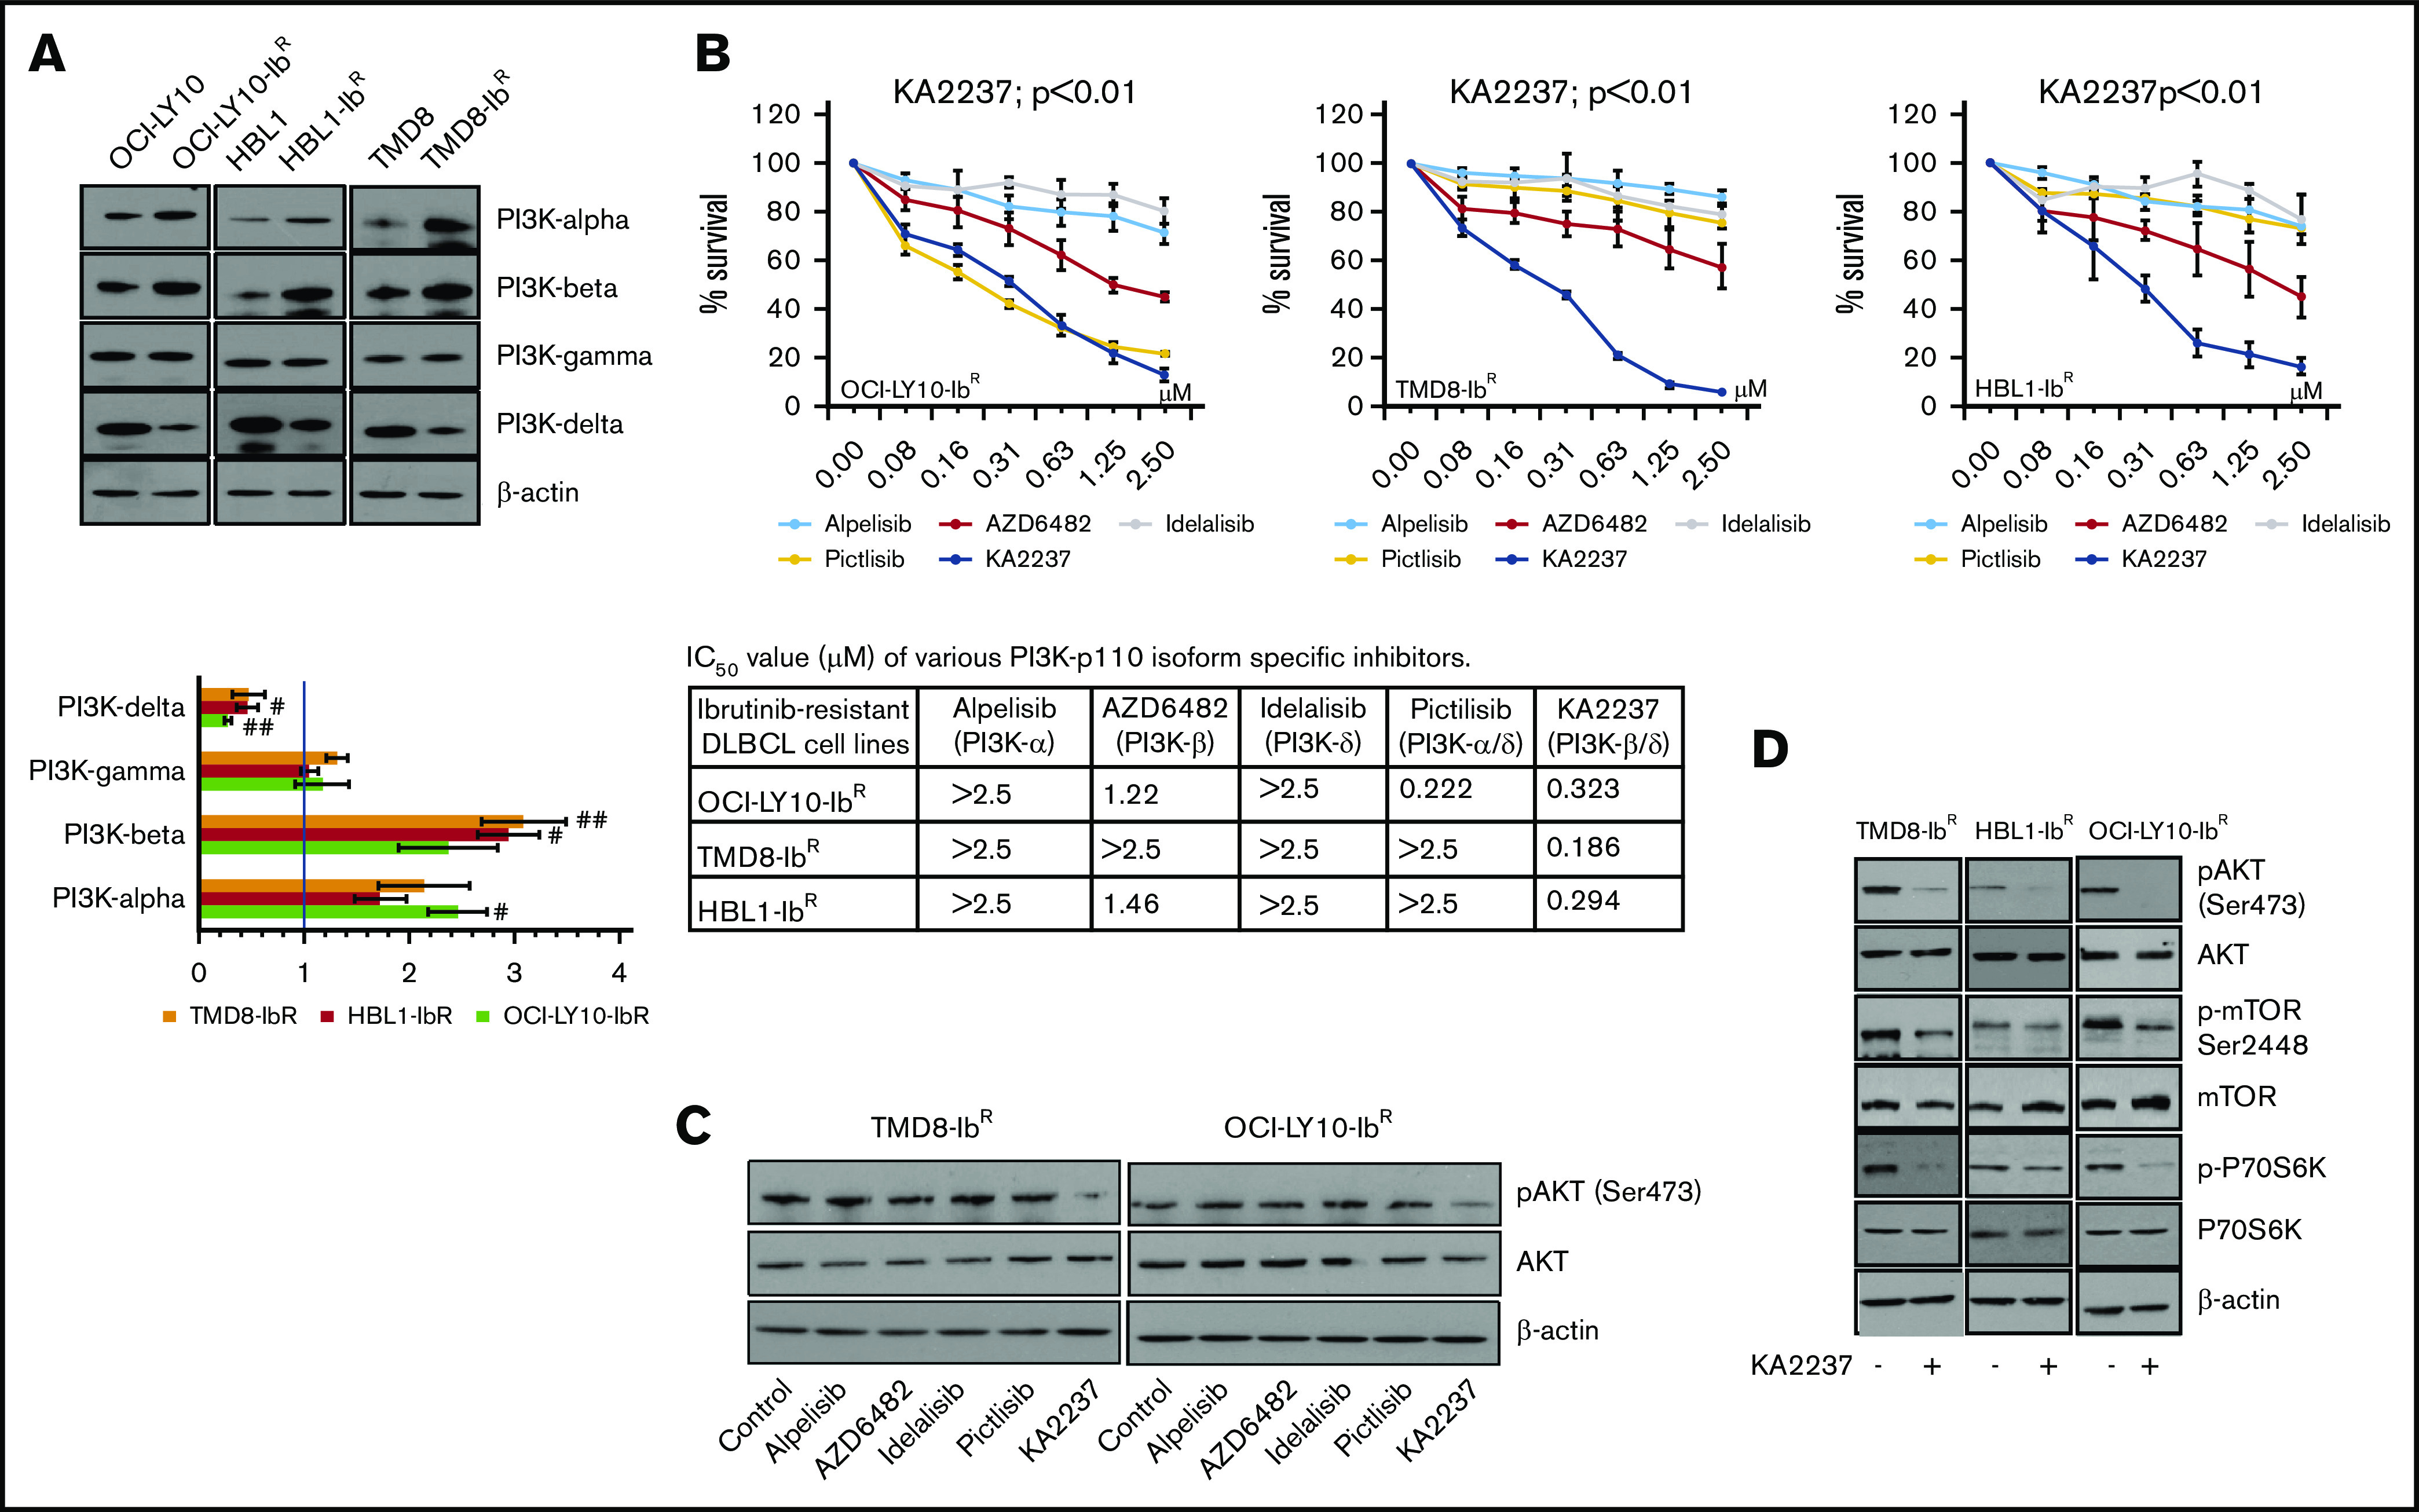
Figure 3.

PI3K inhibitors kill ibrutinib-resistant DLBCL cells. (A) Western blots and quantification of class-I sub-PI3K isoforms in IR/PT DLBCL cells. (B) Metabolic activity analysis for ibrutinib-resistant DLBCL cells treated with specific inhibitors PI3K-α (alpelisib), PI3K-β (AZD6482), PI3K-δ (idelalisib), PI3K-α/δ (pictilisib), or PI3K-β/δ (KA2237). The table shows IC50 values (µM) of inhibitors tested in ibrutinib-resistant DLBCL cells. (C) pAKT levels in ibrutinib-resistant DLBCL cells after 24 hours of treatment (50 nM) with the indicated inhibitors. (D) Western blots representing pAKT levels and activity of mTOR substrate in ibrutinib-resistant DLBCL cells after treatment with the PI3K-β/δ inhibitor (50 nM).
