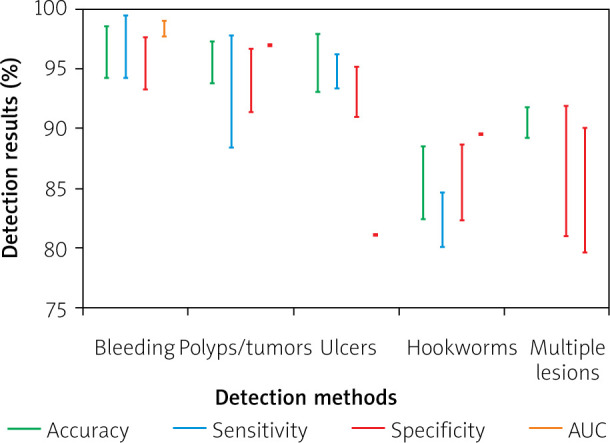
Figure 1.

Graphical representation and comparison of the aforementioned detection methods for the different kind of abnormalities during the last 5 years (2014–2018). The vertical bars indicate overall ranges of accuracy, sensitivity and specificity obtained from various abnormality detection methods. Single points indicate no variance. Missing bars indicate unavailable data due to inconsistent reporting of results across studies
