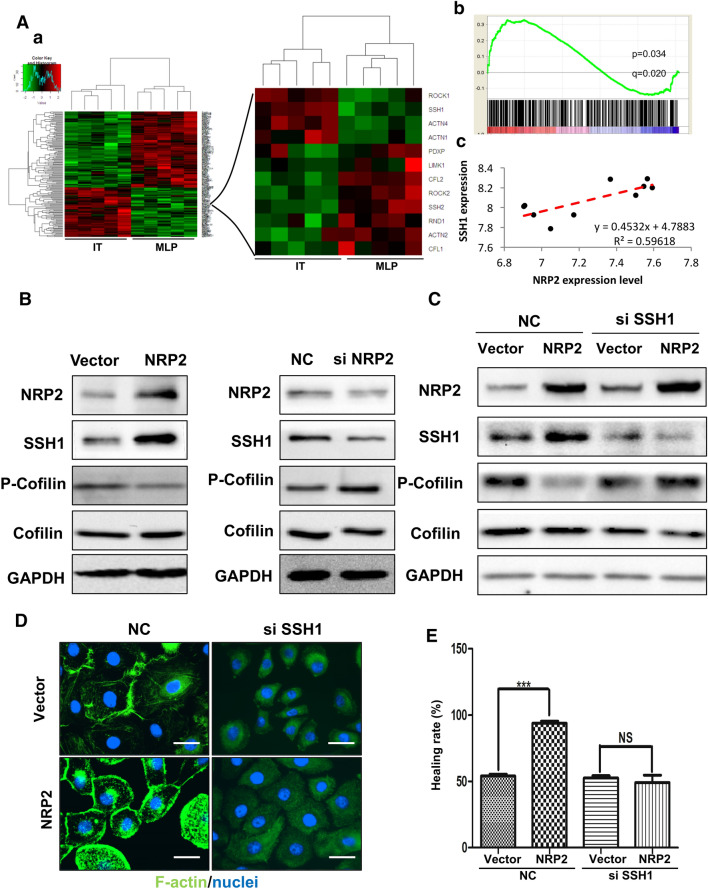
Fig. 5.
NRP2 upregulates cofilin activity by increasing SSH1 expression. A Heatmap of an NCBI dataset (GSE73514) of MLP tumors and ITs. Cluster analysis was performed according to an NRP2 transcription level difference of more than fivefold in 2 groups (red indicates high transcription levels, and blue indicates low transcription levels). a Cluster analysis results. b GSEA mountain plot showing a strong association between the MLP and IT groups. c, Correlation analysis of NRP2 and SSH1 transcription levels. B SSH1 expression in HUVEC-vector and HUVEC-NRP2 cells was detected by Western blot analysis (left panels). SSH1 expression in scramble siRNA- or NRP2 siRNA-treated cells was detected by Western blot analysis (right panels). C HUVEC-vector and HUVEC-NRP2 cells were treated with scramble or SSH1 siRNA. Cells were then lysed and subjected to Western blot analysis with the indicated antibodies. D The fluorescent signals of F-actin (green) and nuclei (blue) are shown (× 1000). E The migratory properties of the cells were analysed by the wound-healing assay. The data are presented as averages from 3 independent experiments (***P ≤ 0.001 by Student’s t test)

