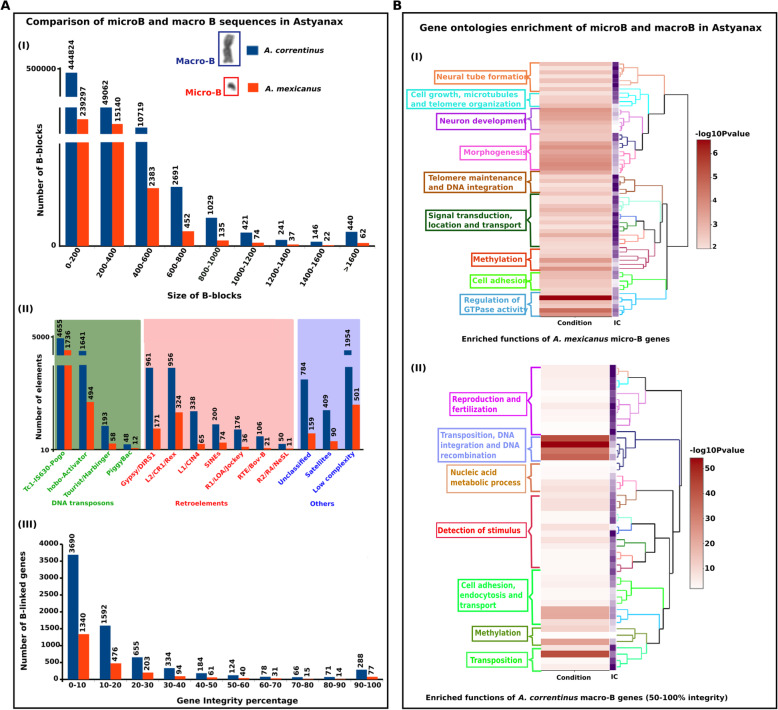
Fig. 2.
Characterization of genomic regions detected on the microB of A. mexicanus and macroB of A. correntinus. a (I) A comparison between B blocks number with respective blocks size range. (II) Repeat annotations of B blocks showing the abundance of diverse classes of DNA transposons on the B chromosomes. (III) Results of gene integrity analysis showing the number of genes (Y axis) in each integrity percentage group (X axis). The bar charts are scaled with breaks to normalize difference in data. b Heatmap plots and clustering visualization of GO enrichment of gene contents on microB (I) of A. mexicanus and macroB (II) of A. correntinus. The enriched functions are colored according to the dendogram of GO clusters based on the semantic similarity distance and ward.D2 criteria. The higher the -log10 P-value, the more enriched the functions. Notice the enrichment of functions associated with DNA integration, DNA recombination, transposition, cell growth, microtubules organization and telomere maintenance that might have provided transmission advantage and formation of a protoB

