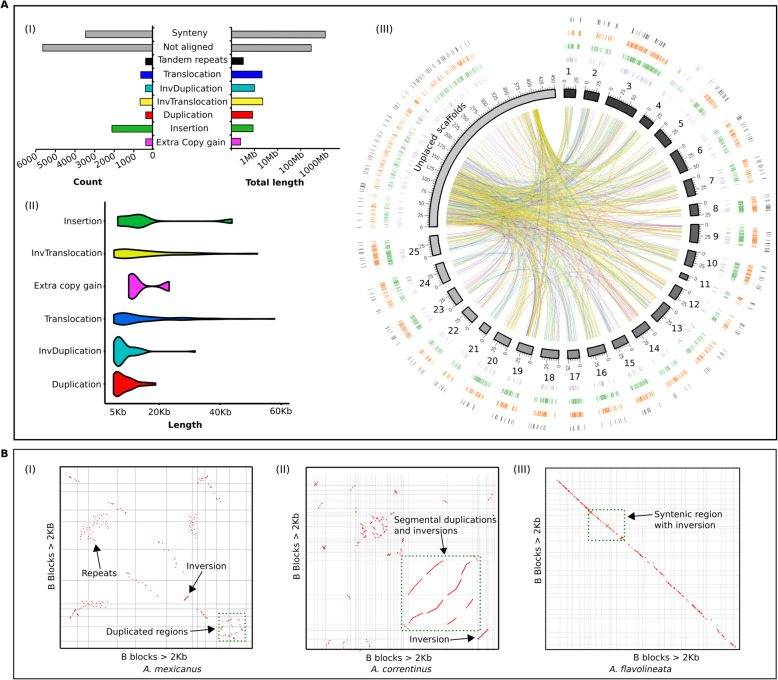
Fig. 7.
Genomic differences between the B- and B+ genomes of cavefish and B chromosome associated patterns of evolution. a (I) The bar graphs show the total number of different rearrangements and their total length in Mb in the B+ genome of A. mexicanus. (II) The violin plot depicts the length distribution of each rearranged block in the B+ genome. The distribution of rearrangements with at least 5Kb length is plotted. Refer to Supplementary Fig. S13 for distribution of smaller size rearrangements. (III) Circos plot of B+ genome visualize the different types of genomic rearrangements. Chromosomes (black to grey) are plotted from 1 to 25 with unplaced scaffolds merged as pseudo-scaffolds. The outer rings correspond to tandem repeats (black), deletions (orange), insertions (green), extra copy gains (purple). The inside links show the rearrangements as duplication (red lines), translocation (blue lines), inverted duplication (light blue) and inverted translocation (yellow). b The self syntenic dotplots of B chromosomes in A. mexicanus (I), A. correntinus, (II) and A. flavolineata (III) are annotated with different evolutionary events indicated with arrows and green dotted boxes. The dotplot graphics are visualized as filtered “legacy version” whereas the raw images are given as Supplementary Figs. S15, S16, S17

