Fig. 6.
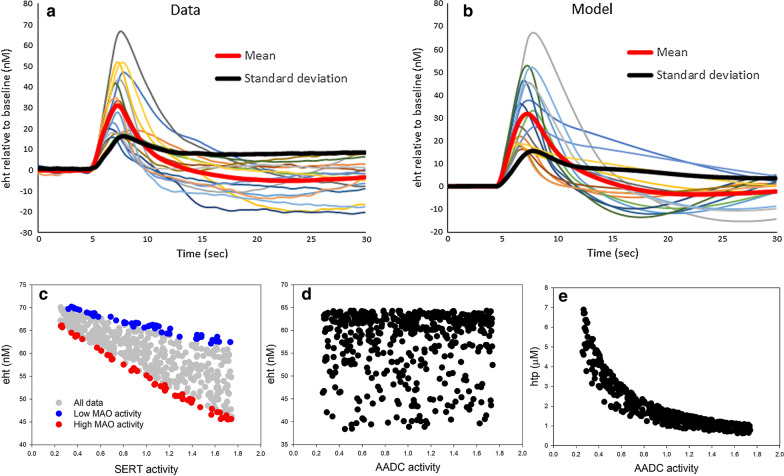
Investigations using the systems population model. a Shows the time courses of eht in the hippocampus of 17 male mice after 2 s of stimulation at s (Hashemi Lab). The thick red and black curves are the time courses of the mean and standard deviation, respectively. The response curve are diverse and have different heights, peaks and shapes. b Shows 17 randomly selected response curves in a systems population model of 1000 individuals with 40% independent variation in many parameters in the model (see text in “Variability in response to stimulation” section for details). The red and black curves are the time courses of the mean and the standard deviation of the 1000 model individuals, respectively. c Shows a systems population model of 500 individuals where the expression values of SERT and MAO were varied from 25 to 175% of normal and all other constants were fixed. The blue dots are individuals with low MAO activity and the red dots are individuals with high MAO activity. SSRIs have a greater effect on individuals with high MAO activity. d, e The results from a systems population model (500 individuals) where blood tryptophan and the expression level of AADC were varied from 25 to 175% of normal and all other constants were fixed. d Shows that eht is uncorrelated to AADC activity. e Shows that as AADC activity goes down htp concentration goes up so the flux through AADC remains nearly constant. This may explain why supplementation by vitamin B6 (a co-factor for AADC) is an ineffective treatment for depression

