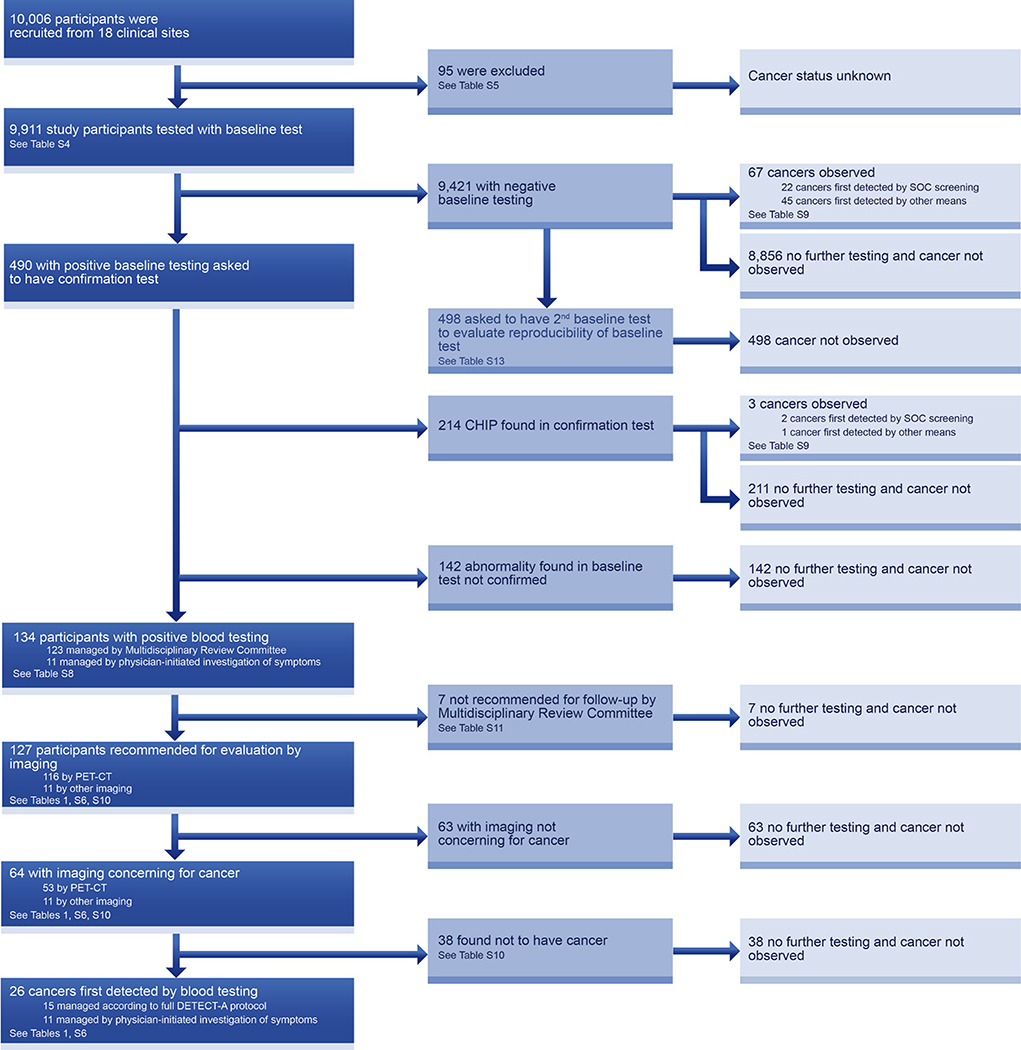
Fig. 2. Flowchart describing the DETECT-A study.
The DETECT-A diagnostic path (dark blue) indicates how cancers first detected by blood testing were identified. Each box indicates both the number of individuals proceeding through each step as well as the relevant table that provides additional detail.

