Fig. 3.
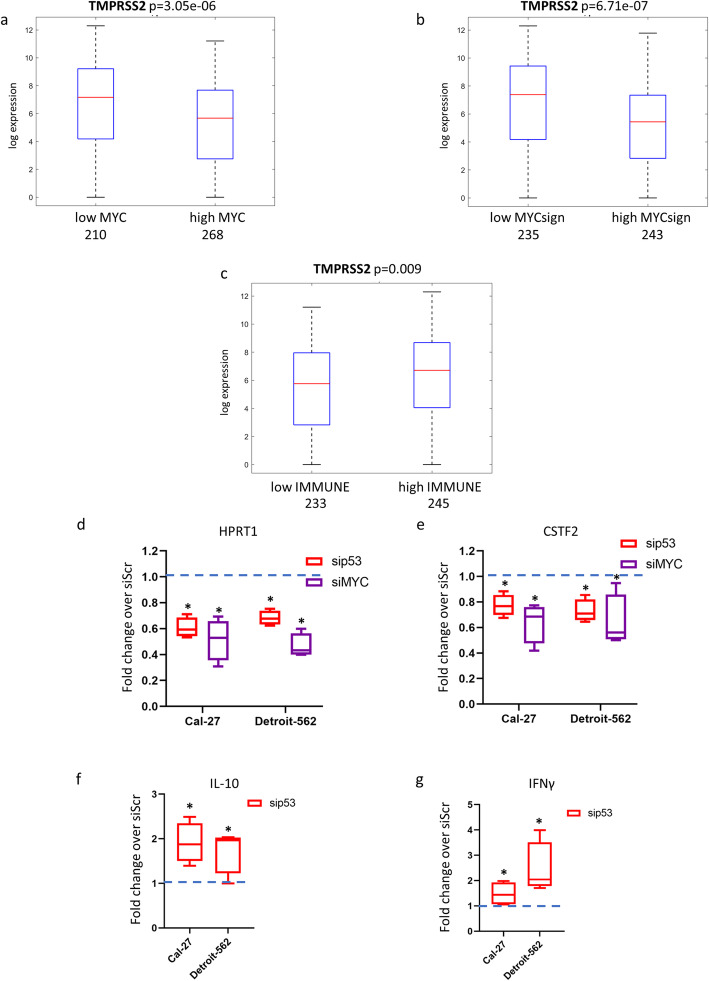
TMPRSS2 gene association with MYC signature and immune signature in HNSCC patients. a Box-plot analysis representing TMPRSS2 gene expression levels in tumoral HNSCC TCGA samples according to low or high expression values of MYC gene. b Box-plot analysis representing TMPRSS2 gene expression levels in tumoral HNSCC TCGA samples according to low or high expression values of 22-gene MYC signature. c Box-plot analysis representing TMPRSS2 gene expression levels in tumoral HNSCC TCGA samples according to low or high expression values of 17-gene immune signature. d-e qRT-PCR analysis of HPRT1 (d) and CSTF2 (e) expression levels in Cal-27 and Detroit-562 cell lines upon depletion of mutant p53 (sip53) or MYC (siMYC) compared to scramble control cells (value = 1). (f, g) qRT-PCR analysis of IL-10 (f) and IFNγ (g) expression levels in Cal-27 and Detroit-562 cell lines upon depletion of mutant p53 (sip53) or MYC (siMYC) compared to scramble control cells (value = 1). *p-value < 0.05

