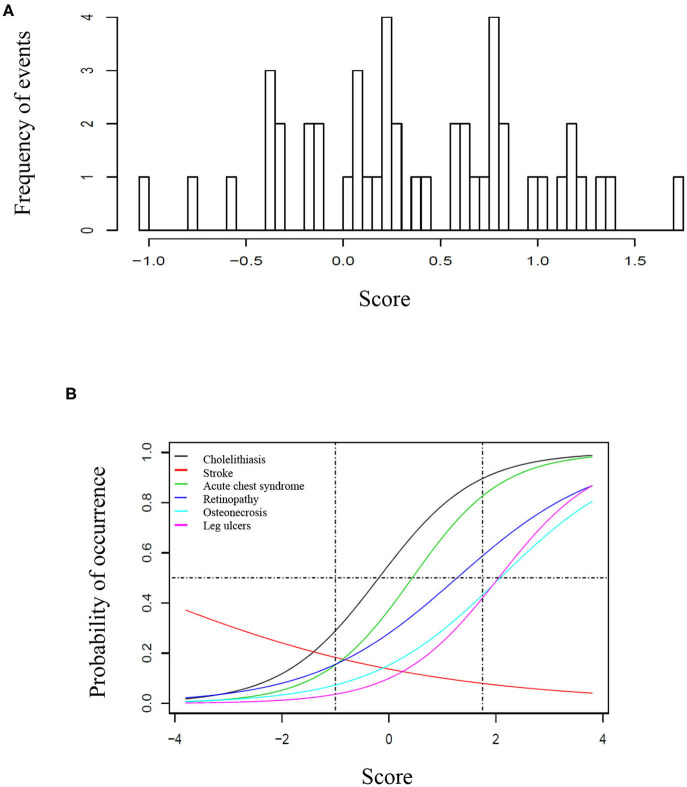
Figure 1.
Score of clinical complications in the study cohort. (A) Histogram representing the score of clinical complication calculated for each patient based on the item-response theory (ITR). (B) Characteristic curves for each clinical complication, based on the IRT score. (A) Represents the score based on the distribution of complication for each patient, ranging from −1 to ~1, 8. In (B), the curves are shown from −4 to 4 to better illustrate the trend of each curve, however the vertical traced lines indicate the interval where patients are located. In this cohort, the probability of occurrence was higher for cholelithiasis, followed by acute chest syndrome, retinopathy, osteonecrosis, and leg ulcers. The horizontal line represents 50% of probability. For instance, a patient with 50% probability of having retinopathy had >50% probability of presenting cholelithiasis and acute chest syndrome, but <50% for osteonecrosis and leg ulcers. Patients who presented stroke had less probability of presenting all other clinical complications.

