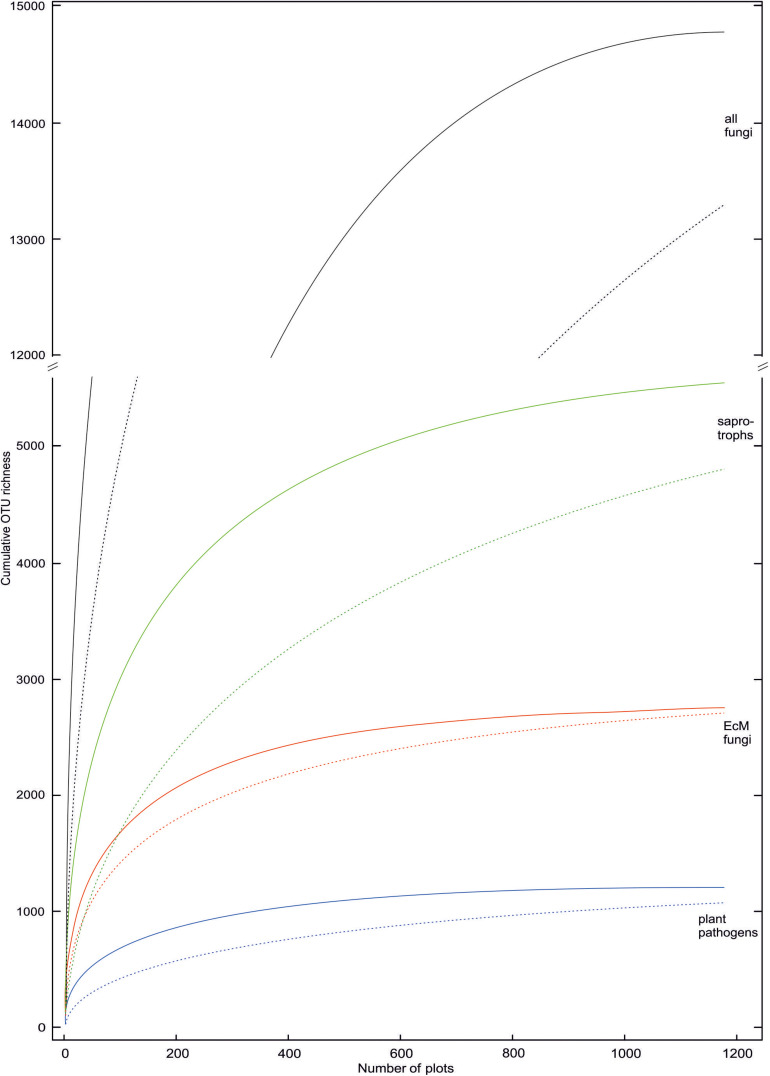
FIGURE 4.
Rarefied OTU accumulation curves for all fungi and ectomycorrhizal, saprotrophic and plant pathogenic groups therein. Solid and dashed lines indicate inclusion and exclusion of sample-wise singletons (one sequence in a sample) in samples, respectively. These singletons are locally rare OTUs that may potentially represent index-switching artifacts.

