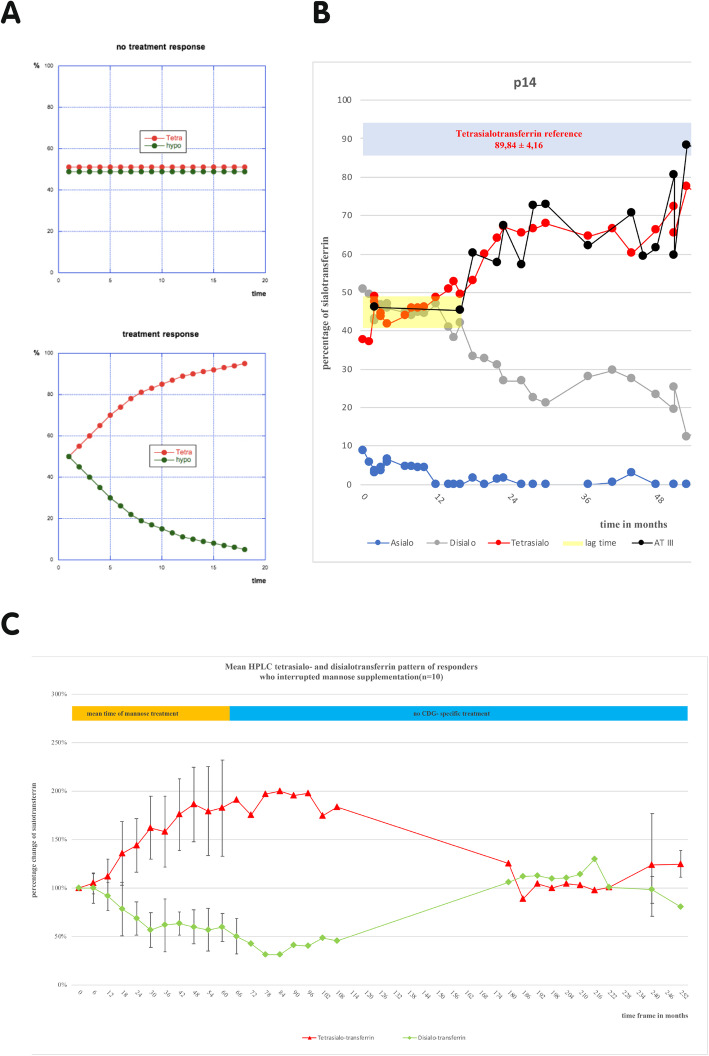
Fig. 1.
a Hypothetical scheme showing expected curves with response or non-response to mannose treatment. b Many responders showed a lag time of fluctuating sialo-transferrin values before response (mean 21 ± 8 months). The graph shows the sialo-transferrin-HPLC pattern during mannose supplementation of an index patient. Red line represents tetrasialo-transferrin, green line represents hypoglycosylated disialo-transferrin. This patient showed physiological fluctuations under mannose treatment for approximately 17 months, before hypoglycosylation improved (yellow area). The example of AT III (black graph) shows, that other glycoproteins like coagulation parameters reacted concordantly to the sialo-transferrin pattern. The blue area represents the physiological value of tetrasialo-transferrin. c Graph showing the percentage change of tetra- (red graph) and disialo-transferrin (green graph) quantified by HPLC of the responding patients. The initial pretreatment values of tetrasialo- and disialo-transferrin were defined as 100%. The sialo-transferrin values measured during mannose supplementation were set in relation to the initial value to show the follow up. Under mannose therapy tetra- and disialo-transferrin values improved steadily to twice the initial value. After cessation of mannose treatment (orange mark), the sialo-transferrin rates declined to nearly pretreatment values (n = 10)

