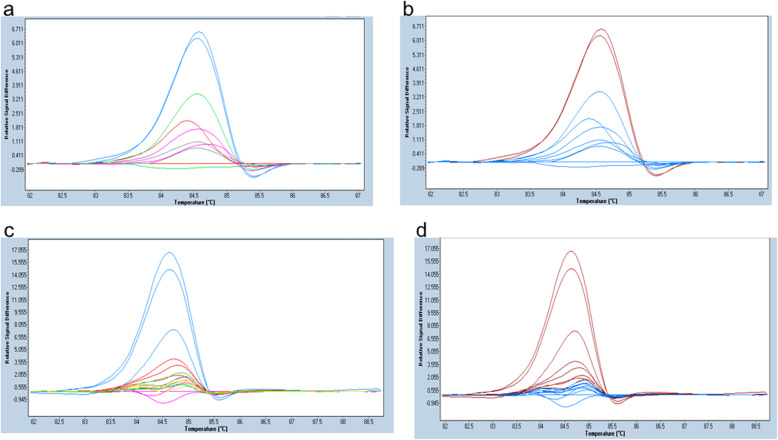
Fig. 6.
Difference plot depicting the different concentrations of Ex19_Std at 2.5 ng/μl & 0.25 ng/μl. a & b depicts HRM assays represented as difference plot, dF/dT (y-axis) is plotted against melting temperature range (x-axis). a depicts peaks with distinct colors annotated to different MAF, and b shows corresponding peaks detected as mutant or wildtype by HRM. Total DNA concentration of each peak was 2.5 ng/μl. MAF annotations in a are Blue (0.25%), Green (0.05%), Pink (0.025%), Grey (0.005%) and Red (wildtype). b shows the detection of mutant by HRM analysis in which Red is for Mutation positive and Blue for wildtype. Note that the detection by HRM as variant (shown as red peak in b) is only for the blue peak in a, which is 0.25%. c & d have a DNA concentration of 0.25 ng/μl. Samples with different MAF in c are annotated as Blue (50%), Red (5%), Grey (1%), Green (0.5%), Yellow (0.1%) and Pink wild-type. d shows the detection of variants by HRM. Red depicts Mutation positive and Blue depicts wildtype. Note that in d, HRM assay detected as mutant consistently in blue and red peaks in c. This means that HRM consistently detected variants up to 5% MAF

