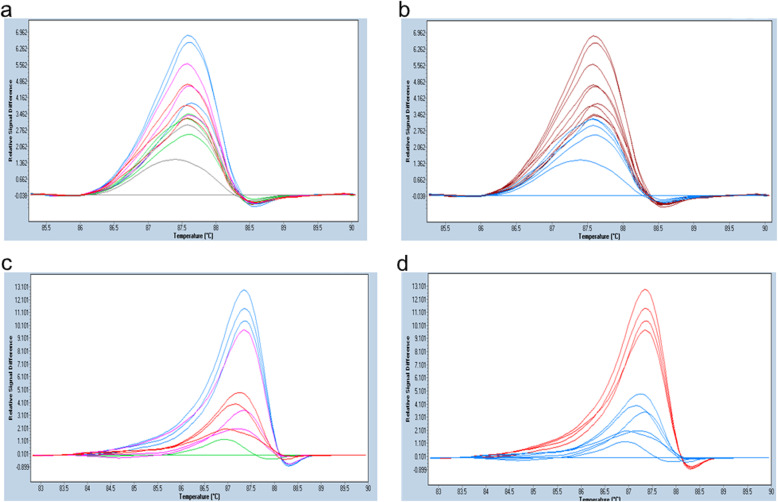
Fig. 7.
Difference plot depicting the different concentrations of Ex21_std at 2.5 ng/μl & 0.25 ng/μl. a and b depicts HRM assays represented as difference plot, dF/dT (y-axis) is plotted against melting temperature range (x-axis). a shows peaks with distinct colors annotated to different MAF, and b shows corresponding peaks detected as mutant or wildtype by HRM. Samples in both a & b have a total DNA concentration of 2.5 ng/μl. MAF annotations in a are Blue (1%), Pink (0.5%), Red (0.25%), Green (0.125%), and Grey (wildtype). b shows the detection of mutation (Red) or wildtype (Blue) by HRM. Note that the HRM detected mutants consistently (as red peak in b) in blue (1%), pink (0.5%) and red (0.25%) peaks in a. c & d have a DNA concentration of 0.25 ng/μl. c shows the difference plot depicting different MAF of Ex21_std as Blue (10%), Pink (5%), Red (2.5%) and Green (wild-type). d depicts the corresponding MAF as variant (Red) or wildtype (Blue). Note that the HRM consistently identified as variants (as red peak in d) in only blue peak (10% MAF)

