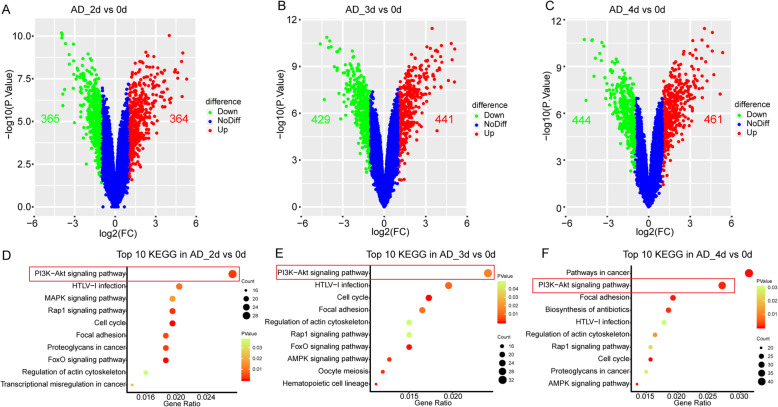
Fig. 2.
DEGs and KEGG pathway analysis in the three time points of the AD. a–c The volcano plot for DEGs of adipogenic differentiation at the d2, d2, and d4, respectively. The red point indicates upregulated genes and the green represented downregulation while the blue meant no difference. (DEGs were identified as differentially expressed when P value < 0.05 and fold change (FC) ≥ 2). d–f Top 10 of DEG enrichment pathway resulted at the d2, d3, and d4 of the AD, respectively. The point size meant the gene numbers while the point color represented the P value (P value < 0.05). AD adipogenesis

