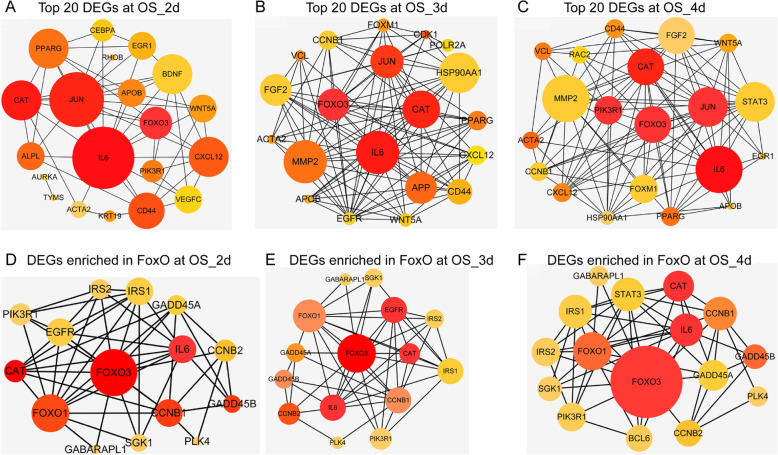
Fig. 4.
Key gene analysis in the OS. a–c Network representation of the protein-protein interactions (PPI) between the top 20 genes of the DEGs in different time points in the OS by the Between mode using cytoHubba app in the Cytoscape. The node’s colors donated the clustering coefficient, and the brighter the color, the higher the clustering, which meant stronger interaction (range from red (high) to yellow (low)), while the size of each node represented node degree distribution. d–f PPI visualization of networks with the DEGs enriched in the hub pathway (FoxO signaling pathway) of the OS, the color, and size of each point meant as the same meaning as above. a, d 2d vs 0d; b, e 3d vs 0d; c, f 4d vs 0d

