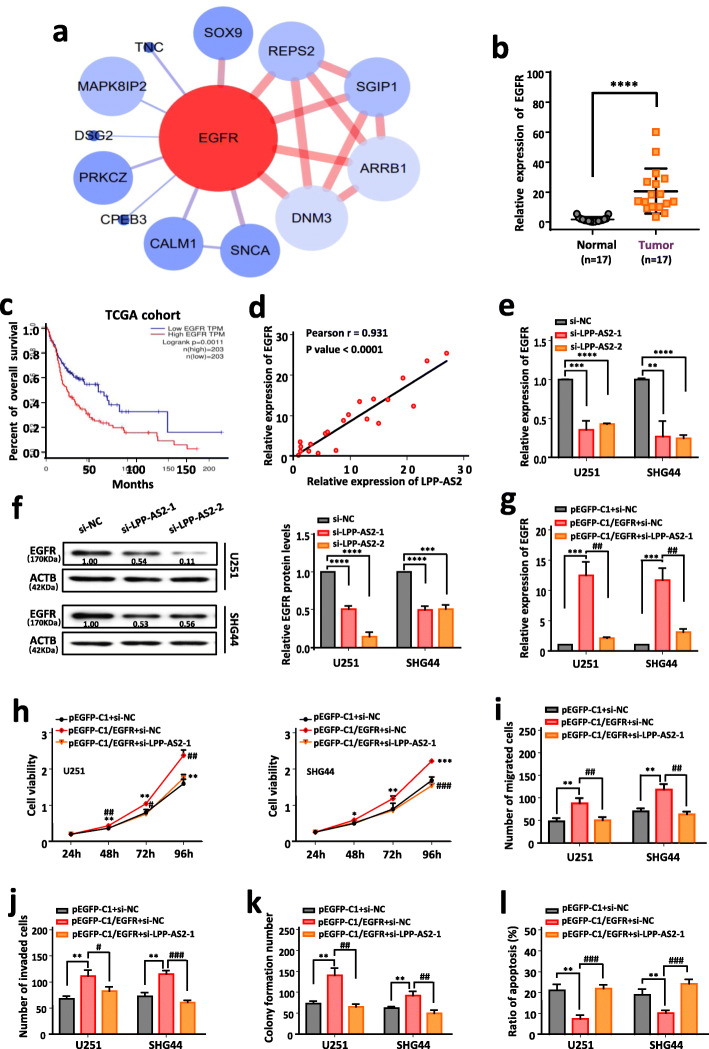
Fig. 4.
LPP-AS2 facilitates tumor progression by regulating expression of EGFR. a Corresponding mRNAs in co-expression analysis network of LPP-AS2. Upregulated mRNAs are shown in red and downregulated mRNAs are shown in blue. b Relative expression of EGFR in 17 glioblastoma tissues and 17 normal brain tissues by RT-qPCR. c Kaplan-Meier analysis of overall survival in glioma patients with low (n = 203) and high (n = 203) level of EGFR. P value was calculated by Mantel-Cox log rank test. d The Pearson correlation between LPP-AS2 level and EGFR level was measured in the same set of glioblastoma tissues. The ΔCt values (normalized to GAPDH) were subjected to Pearson correlation analysis (R = 0.93, P < 0.0001). e Knockdown of LPP-AS2 significantly inhibited EGFR expression in U251 and SHG44 cells. f Protein level of EGFR in U251 and SHG44 cells after treated with siRNAs of LPP-AS2. g Relative expression of EGFR in U251 and SHG44 cells transfected with pEGFP-C1/EGFR alone or co-transfection with siRNAs of LPP-AS2. h CCK8 assays in U251 and SHG44 cell treated with pEGFP-C1/EGFR alone or co-transfection of si-LPP-AS2–1. i, j Histogram of migration and invasion assays in U251 and SHG44 cells treated with pEGFP-C1/EGFR alone or co-transfection of si-LPP-AS2–1. k Colony formation assay in U251 and SHG44 cells treated with pEGFP-C1/EGFR alone or co-transfection of si-LPP-AS2–1. l Histogram of cell apoptosis rate in U251 and SHG44 cells treated with pEGFP-C1/EGFR alone or co-transfection of si-LPP-AS2–1. Error bars, s.e.m. from three independent experiments. *P < 0.05; **P < 0.01; ***P < 0.001; ****P < 0.0001; #P < 0.05; ##P < 0.01; ###P < 0.001; ####P < 0.0001 (Student’s t test)

