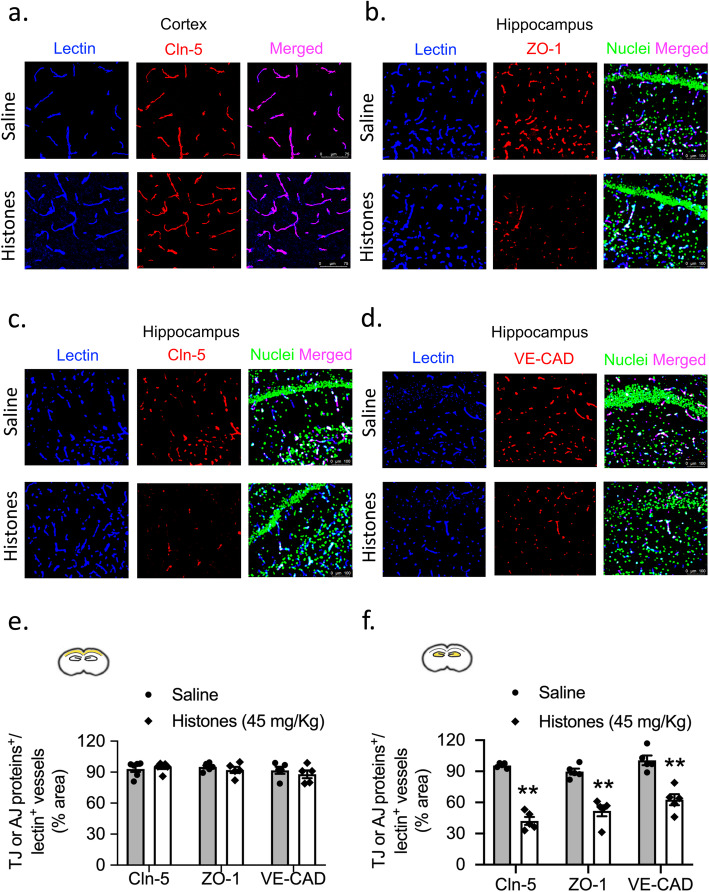
Fig. 5.
Histones decrease TJ and AJ protein expression levels in vivo. Confocal microscopy images of brain sections from a cerebral cortex of claudin-5 (red) co-stained with lectin (blue) and b–d from hippocampus of TJ proteins ZO-1, claudin-5, and AJ protein VE-cadherin (red) co-stained with lectin (blue). Nuclei staining (DAPI) was pseudocolored in green in hippocampus slides. e, f Quantification of ZO-1, claudin-5, and VE-cadherin coverage on lectin-positive microvessels in capillaries of cortex and hippocampus at 24 h post-saline or histone treatment. Scale bars = 75 μm (cerebral cortex), 100 μm (hippocampus). Mann–Whitney; **P < 0.01; mean ± S.E.M.; n = 5 mice per group

