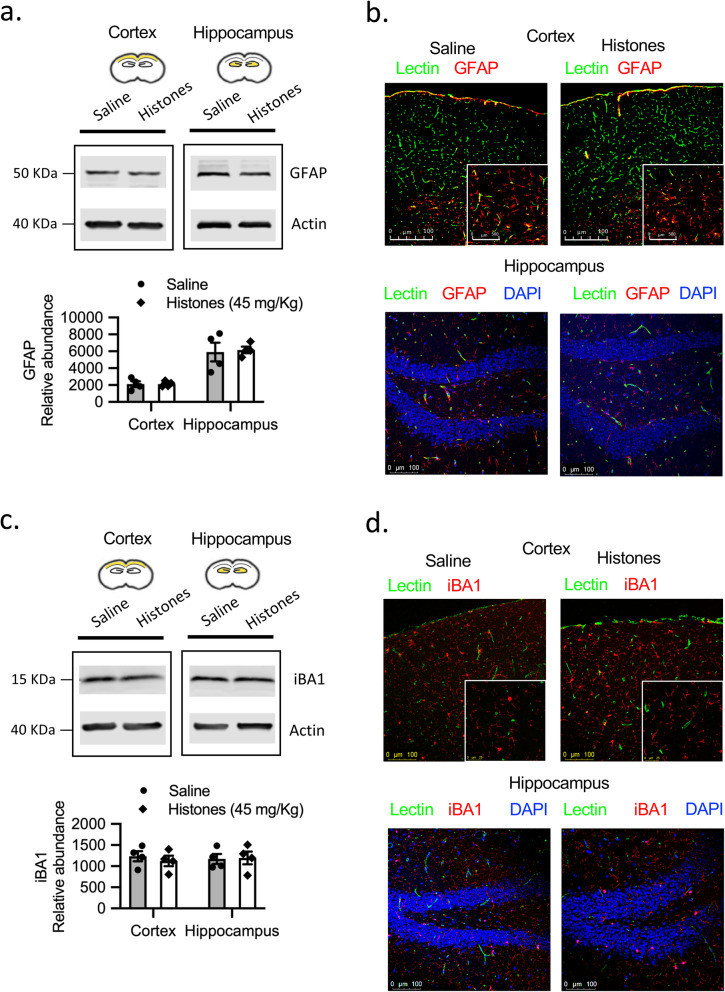
Fig. 6.
Circulating histones do not activate astrocytes or microglia in vivo. a Western blots of GFAP in cerebral cortex and hippocampus homogenates at 24 h post-saline or histones treatment. Quantification of GFAP protein abundance relative to ß-actin loading control. Mean ± S.E.M.; n = 4 mice per group. For gel source data, see Supplementary Fig. 5. b Confocal microscopy images of GFAP (red) and lectin (green) in cerebral cortex and hippocampus. Representative images of 3–4 mice per group. Scale bar = 100 μm. c Western blots of iBA1 in cerebral cortex and hippocampus homogenates at 24 h post- treatment post-saline or histones treatment. Quantification of iBA1 protein abundance relative to ß-actin loading control. Mean ± S.E.M.; n = 4 mice per group. For gel source data, see Supplementary Fig. 6. d Confocal microscopy images of iBA1 (red) and lectin (green) in cerebral cortex and hippocampus. Representative images of 3–4 mice per group. Scale bar = 100 μm

