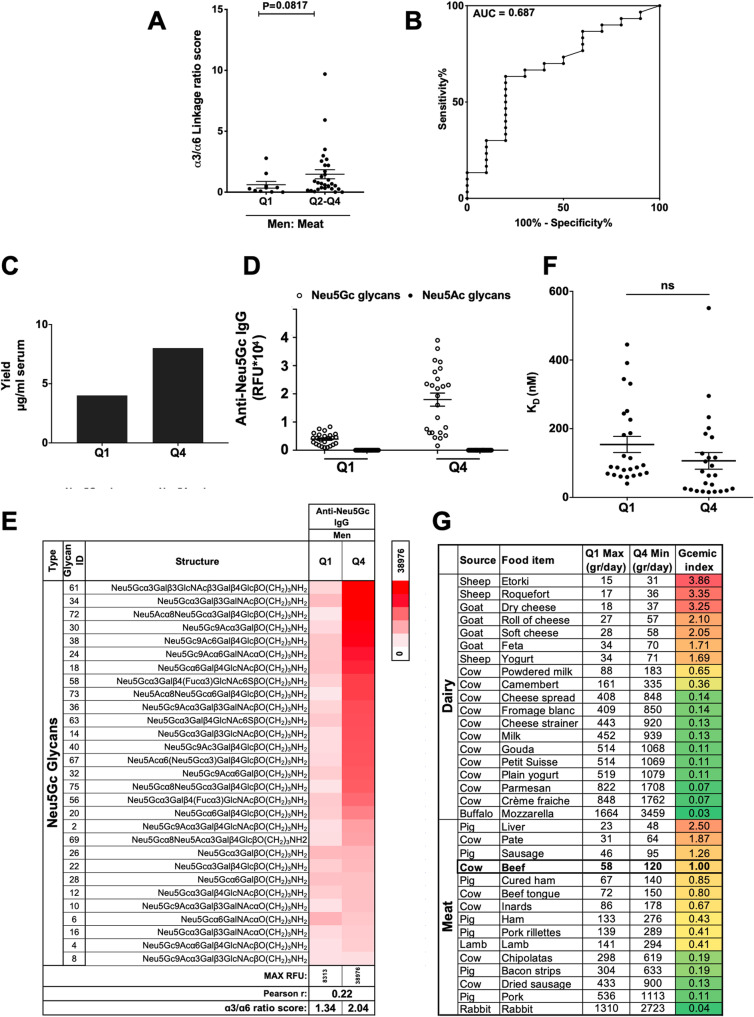
Fig. 5.
Characteristics of anti-Neu5Gc IgG and Neu5Gc in food. a Ratio between sum anti-Neu5Gc IgG against α3-linked-/α6-linked-Neu5Gc-glycans calculated in men 45–60 stratified based on meat Neu5Gc intake (Fig. S3). The α3/α6 linkage ratio in Q1 (n = 10) is lower than that in Q2–Q4 (n = 30) (Mann-Whitney test; p = 0.08; Q1 0.6080 ± 0.2806, Q2–Q4 1.472 ± 0.3722; mean ± sem). Similar comparing Q1 and Q4 (p = 0.09; Q1 0.6080 ± 0.2806, Q4 1.384 ± 0.3961). b ROC curve of α3/α6 linkage ratio score in Q1 (n = 10) compared to Q2–Q4 (n = 30) showed AUC 0.687 ± 0.098 (p = 0.08). Similar between Q1 and Q4 (p = 0.08, AUC 0.73 ± 0.1162). c Anti-Neu5Gc antibodies were affinity-purified from pooled sera of men 45–60 consuming low/high Neu5Gc from meat (Q1 5.39 ml and Q4 6.8 ml sera; n = 10 per group). Antibody yield was higher in Q4 than Q1 (8.01 versus 4.01 μg/ml serum, respectively). d, e IgG reactivity on sialoglycan microarrays (2 μg/block; detected with Cy3-anti-human IgG) revealed high specificity against Neu5Gc-glycans, no reactivity against Neu5Ac-glycans (d; each dot is IgG response/glycan), with altered diversity of glycans in Q4 over Q1 (e; Pearson r = 0.22). The α3/α6 linkage ratios: Q1 1.34, Q4 2.04. f Affinity (KD) per glycan calculated from anti-Neu5Gc IgG on microarrays at 16 serial dilutions (40–4.9 × 10⁻³ ng/μl; 266.7–0.033 nM; non-linear fit with one-site specific binding), showing no change in affinities with higher Neu5Gc intake (mean ± sem; t test). g Gram of food to consume to reach daily nmol Neu5Gc per quartile based on Neu5Gc content (measured by DMB-HPLC). Q1 max value based on gr food to reach men Q1 average of 9443 nmol/day. Q4 min value is based on gr food to reach women Q4 average of 19,627 nmol/day. Gcemic index is the Neu5Gc content (nmol/gr) in each food item relative to the amount measured in beef (163 nmol/gr)

