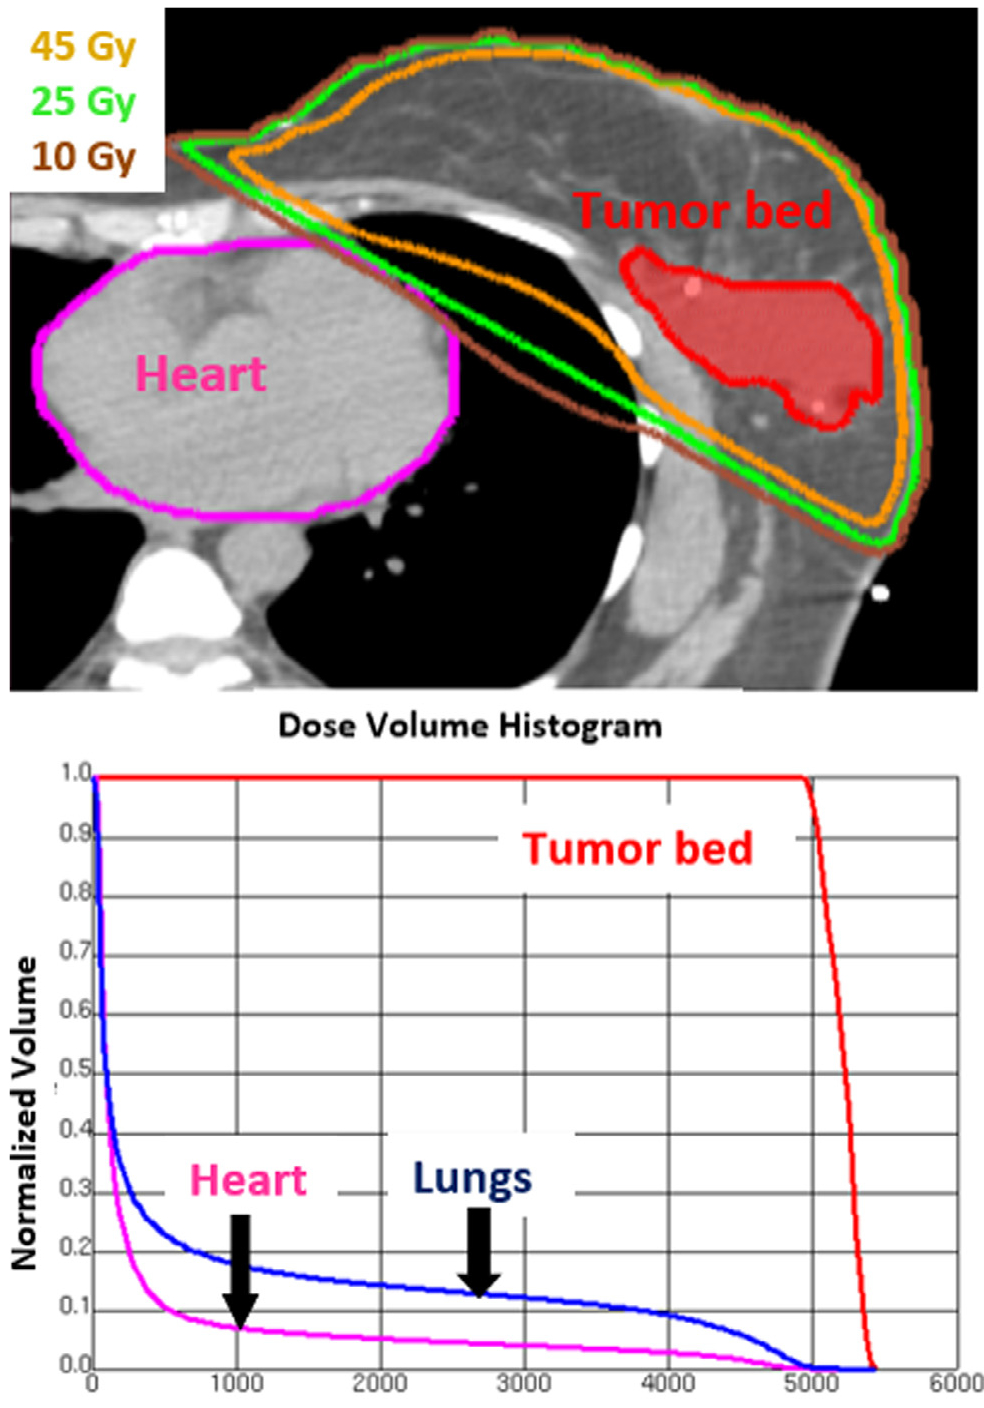
Figure 1.

Dose volume histogram used to calculate heart radiotherapy dose. The upper panel shows an axial slice from the pretreatment planning computed tomography scan with tumor bed and heart contoured. Isodose lines for 45 Gray, 25 Gray, and 10 Gray are shown as well. The lower panel shows the associated dose volume histogram. Absolute doses for fractions of the total structure volume are displayed. For example (see heart arrow), 10 Gray are delivered to 7% of the total heart volume.
