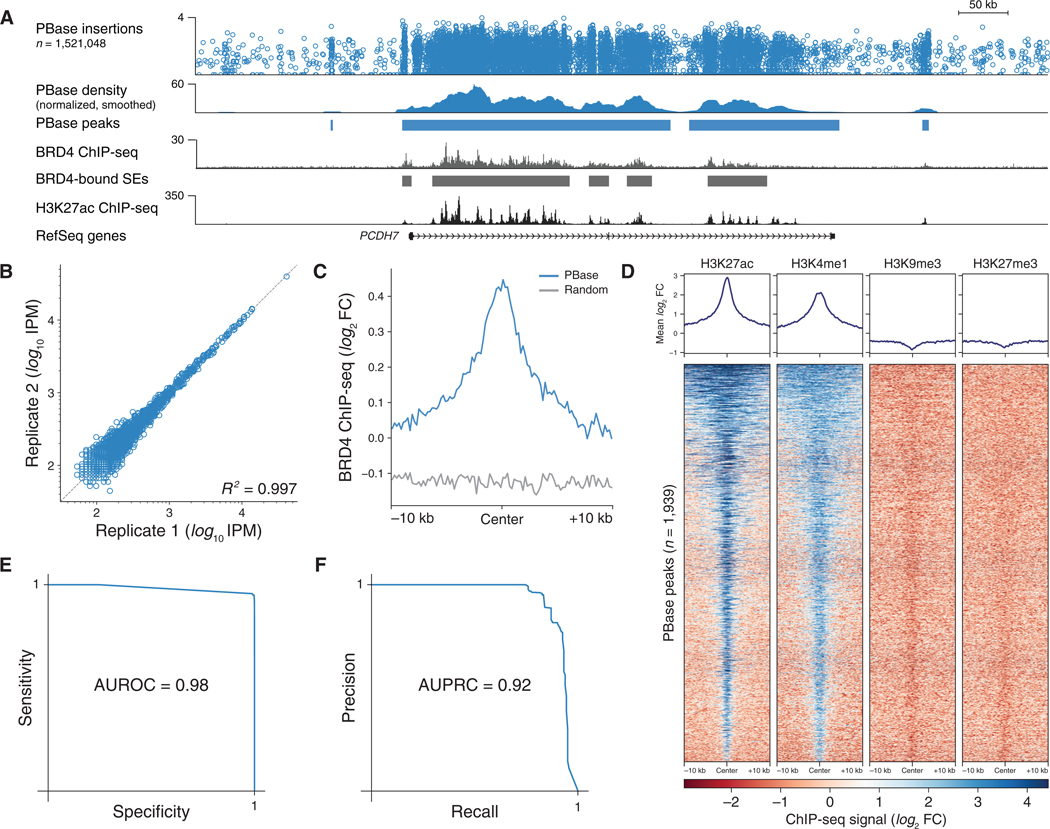
Figure 2. Undirected piggyBac SRTs Mark BRD4-Bound Super-enhancers.
(A) Browser view of an undirected PBase insertions in HCT-116 cells at a SE alongside BRD4 and H3K27ac ChIP-seq data.
(B) Reproducibility of normalized insertions at PBase peaks.
(C) Mean BRD4 ChIP-seq signal at PBase peaks compared to permuted control set.
(D) Heatmap of H3K27ac, H3K4me1, H3K9me3, and H3K27me3 ChIP-seq signal at PBase peaks.
(E) Receiver-operator characteristic curve for SE detection using PBase peaks.
(F) Precision-recall curve for SE detection using PBase peaks.
See also Figure S1. SE, super-enhancer; IPM, insertions per million mapped insertions; AUROC, area under receiver-operator curve; AUPRC, area under precision-recall curve; FC, fold change.

