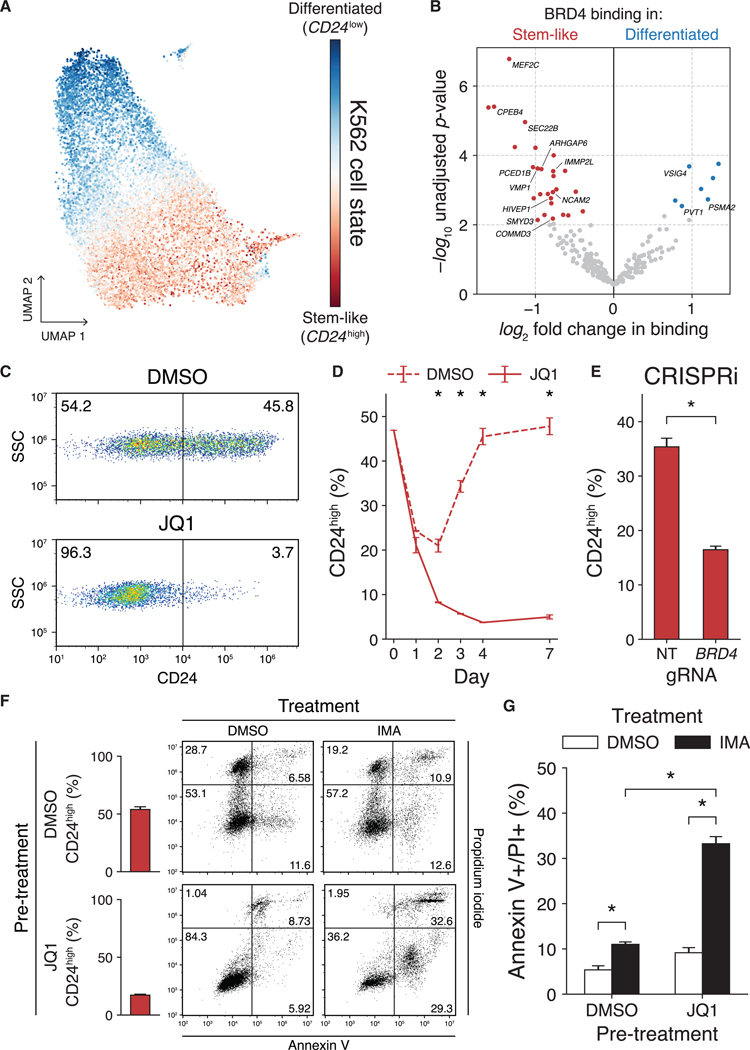
Figure 5. scCC Uncovers Bromodomain-Dependent Cell-State Dynamics in K562 Cells.
(A) Gradient of cell states from scRNA-seq analysis of K562 cells.
(B) Differential BRD4 binding analysis of undirected HyPBase peaks in K562 cells.
(C) Representative distributions of CD24high and CD24low cells after either 96 h of DMSO (top) or JQ1 (bottom) treatment.
(D)Proportion of CD24high cells over a 7-day time course of JQ1 treatment (three-way ANOVA p < 0.01).
(E) Proportion of CD24high cells after BRD4 CRISPRi (Welch’s t test p < 0.01).
(F) Representative plots of annexin V and PI staining in K562 cells pretreated with either DMSO or JQ1 (250 nM) and subsequently treated for 48 h with either DMSO or imatinib (1 μM).
(G) Quantification of (F) (two-way ANOVA p < 0.01).
See also Figures S5 and S6. Bars represent means; error bars denote standard deviations. Experiments were performed in triplicate. DMSO, dimethyl sulfoxide; SSC, side scatter; CRISPRi, CRISPR interference; NT, non-targeting; gRNA, guide RNA; IMA, imatinib; PI, propidium iodide.

