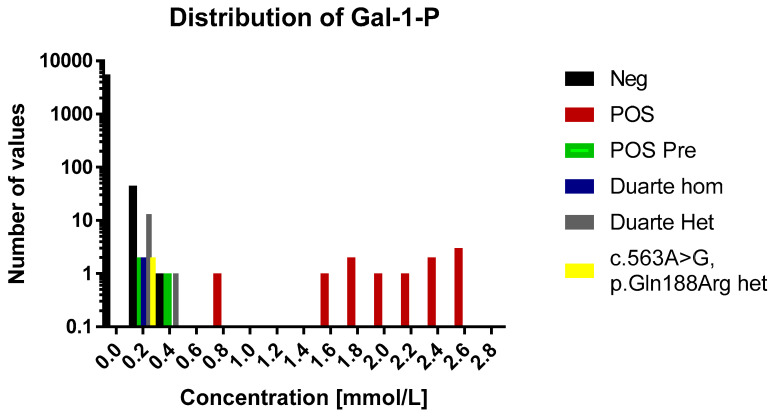
Figure 1.
A histogram over the distribution of GAL-1-P results of the study. The histogram is divided into 0.2 mmol/L bins. Each sample category is signified by a separate color. For the sake of easy comparison the y axis is logarithmic in scale. Legend: Neg, negative for galactosaemia; POS, positive for galactosaemia; POS Pre, positive for galactosaemia diagnosed before birth; Duarte Hom, homozygote for Duarte mutation; Duarte Het, heterozygote for Duarte mutation; c. 563A>G, p.Gln 188Arg het, heterozygpte for classical galactosaemia.

